


At its June meeting, the FOMC again raised the target range for the federal funds rate by 25 basis points, to 1–1¼ percent. They did so despite evidence that inflation had moderated and that the second estimate of first quarter GDP growth was clearly subpar at 1.2%. Furthermore, despite the fact that 7 of the 12 Federal Reserve district banks had characterized growth in the 2nd quarter as “modest,” as compared with only 4 banks that described it at “moderate” (the NY bank simply said that growth had flattened), the FOMC in its statement described growth as “moderate” (here one needs to know that in Fed-speak “modest” is less than “moderate”). The overall discussion evidenced in the statement and subsequent explanations by Chair Yellen in her post-meeting press conference, together with the fact that the only significant change in June’s Summary of Economic Projections was a slight downward revision in the unemployment rate for 2017, failed to make a convincing argument to this writer that there was a compelling case for a rate move at this time. The principal conclusion we can draw is that the FOMC had already conditioned markets to expect an increase in June and that the FOMC’s main rationale was its desire to create more room for policy stimulus should the economy take a sudden turn to the downside.
Read Debate: Will Shrinking the Fed's Balance Sheet Crash the Markets?
More significant than the rate move, however, was the detail the FOMC provided on its plan to normalize its balance sheet, which elaborated on the preliminary plan it put forward in March. Once the Committee decides to begin that process, it will employ a set of sequentially declining caps, or upper limits, on the amount of maturing assets that will be permitted to run off each month. The cap for Treasury securities will initially be $6 billion per month, and it would be raised in increments of $6 billion every three months until $30 billion is reached. Similarly, the cap for MBS will be $4 billion per month, which would also be raised by that amount every three months until $20 billion is reached. These terminal values would be maintained until the balance sheet size is normalized. Left unsaid was what the size of the normalized balance sheet would be.
If we make some assumptions, it is possible to create a stylized baseline estimate of what the tapering process might look like under the scenario that the FOMC described. The baseline examined here simply establishes what it would take to restore the historical pre-crisis balance sheet relationships with respect to currency and required and excess reserve balances. One rationale for this approach is that the FOMC has clearly indicated a desire to return to utilizing the federal funds rate as its principal policy instrument, which relied in the past on a relatively low level of excess reserves.[1] Here is the list of assumptions describing those balance sheet relationships and others that are used to derive the baseline:
The FOMC historically attempted to keep the ratio of currency outstanding to GDP relatively constant, which today would imply a balance sheet of about $1.43 trillion.
Required reserves are currently about $101 billion; and historically, pre-crisis excess reserves were about 3.78% of required reserves.
The economy is assumed to grow at about 2%, the FOMC’s current expected rate, which determines the path for both currency and reserves. (No assumptions are made about other balance sheet factors, which are relatively insignificant.)
Treasuries are assumed to be allowed to run off according to their maturities, which are calculated on a monthly basis from the detail published regularly by the NY Fed for each security in the SOMA portfolio. (We can’t easily estimate what the maturities of future Treasury reinvestments will be.)
MBS maturities don’t adequately reflect what their effective maturities are – they have an estimated duration of about seven years because of pay-downs. For 2016 the SOMA annual report indicated that pay-downs averaged about $32 billion per month. Conversations with Fed officials reveal that in 2017 pay-downs are averaging about $20 billion per month, which is consistent with the terminal values selected in the FOMC’s plan for MBS. Of course, pay-downs will likely increase, as they did historically when interest rates declined; and they will likely decrease if rates go up.
Given this set of assumptions, the following chart shows the estimated changes in the composition of the SOMA portfolio as it declines according to the schedule published assuming the policy was instituted in its September meeting and took effect in October.[2]
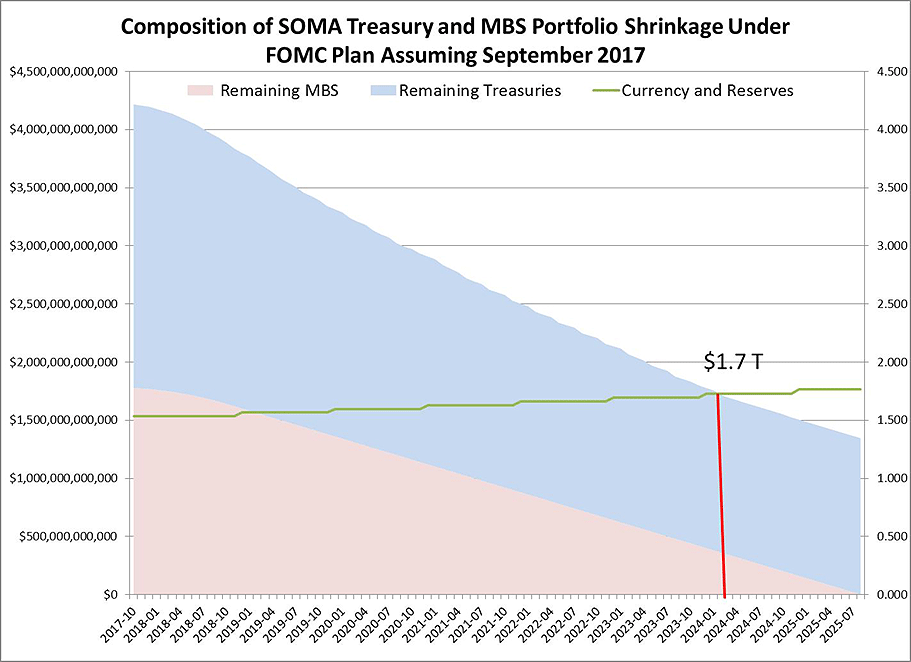
The simulation shows that MBS decline significantly relative to Treasuries and that the historical relationships imply that a normalized balance sheet of $1.7 trillion will be achieved in the spring of 2024. Thereafter, the growth assumptions imply that the Fed should begin to add more and more Treasuries to its holdings, as the remaining MBS simply mature and are paid down. The Fed, under this baseline, would be left with ample amounts of Treasuries with which to conduct open-market operations and to pursue its federal funds targeting regime. Through the remainder of 2017 until the end of 2018 about $246 billion of Treasuries would have to be issued by the Treasury to offset the decline in the Fed’s holdings, which is modest in terms of its potential impact on the Treasuries market. Finally, it is important to recognize that this path would increase or decrease depending upon the realization of MBS pay-downs, stretching out a bit should pay-downs slow. All in all, the plan is gradual, seemingly well thought out, and provides a clear path to an alternative regime.
[1] Of course, the FOMC could employ a corridor policy with the rate on reserves the floor, the discount rate as the ceiling and the federal funds rate as the target policy instrument. This could imply a different normalized balance sheet.
[2] It should be noted that in months when maturing Treasuries are less than the caps, then only that amount is assumed to have run off.


