


With the often misused term “overbought” being thrown around regularly on Wall Street these days, it is a good time to take a step back and assess the odds of a new bear market rearing its ugly head from current conditions.
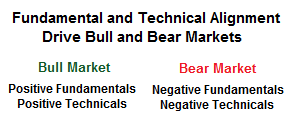
Some on Wall Street make decisions based on economic fundamentals; some use technicals, and others use both. In terms of helping discern between favorable market conditions and unfavorable market conditions, fundamentals and technicals are both important. Bull markets tend to have favorable fundamentals and technicals backing them. Bear markets almost always are associated with weak or negative economic growth and corresponding weakness in the technical state of the markets.
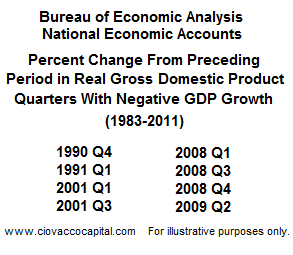
From a fundamental perspective, experienced investors know the periods shown below were less than friendly in terms of returns. Stocks tumbled in July of 1990. Bear markets were wrapped around economic weakness in 2001, 2008, and 2009.
Do we have fundamental conditions in place to suggest a major stock market top is around the corner? Said another way, is there a realistic chance of negative GDP growth occurring in the next several quarters? The Wall Street Journal’s annual survey of the best economic forecasters produced favorable responses on the economy’s prospects in 2011. Similar upbeat results are contained in the latest Blue Chip Economic Indicators survey. The consensus in both surveys is that the economy will grow by at least 3% this year; hardly what we would expect to usher in a new bear market. We do respect (a) forecasting is difficult, and (b) things can change over the next few months, but for now the fundamental outlook remains bullish.
With the Obama Administration looking to increase exports, the recent acceleration in manufacturing activity was encouraging. In the latest ISM survey, the PMI composite index rose 2.3 points to 60.8, the highest level since May 2008. Economists expected a slight decline to 58.0. A 5.8-point jump in new orders to 67.8 represents the best level in seven years. Employment increased 2.8 points to 61.7, the highest reading since the spring of 1973.
Recent data also points to more responsible lending practices in the housing market. According to Freddie Mac, cash-in deals rose 11 points to 46% of all refinancings in Q4, the highest share since data began in 1985. Cash-out deals fell to a record low 16% of refinancings.
Some hints of an improving labor market have surfaced in 2011 as well. Online help-wanted postings jumped a record 11.4% in January 2011, representing the best level since the summer of 2007. New help-wanted postings jumped 16.1% (best since July 2008). Historically, these figures align well with employment gains in the coming months.
If the fundamentals do not align with the onset of a new bear market, what about the technicals? As money managers, we often get forwarded what we term anecdotal evidence “proving” the market is about to peak. We term it “anecdotal” because it often references one or two points in history, instead of looking at ten to thirty years of history. One of the most common concerns sighted is “the current market is overbought and ripe for a correction.” The term “overbought” is the laziest term in technical analysis.
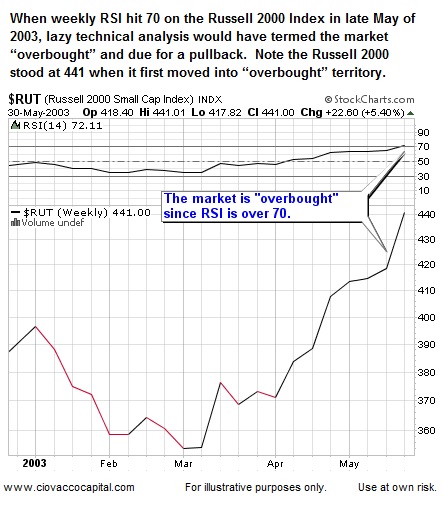
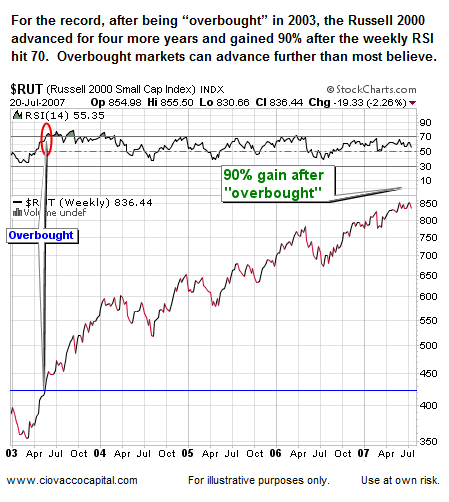
The more important thing to watch is divergences that take place after markets leave an “overbought” state and go on to make a new high while an indicator fails to make a new high (known as a bearish divergence or negative divergence). Some divergences exist today on the chart of the S&P 500 that are of some concern (more on that later). Below, we show the Russell 2000’s performance after the weekly RSI hit 70 in May of 2003.
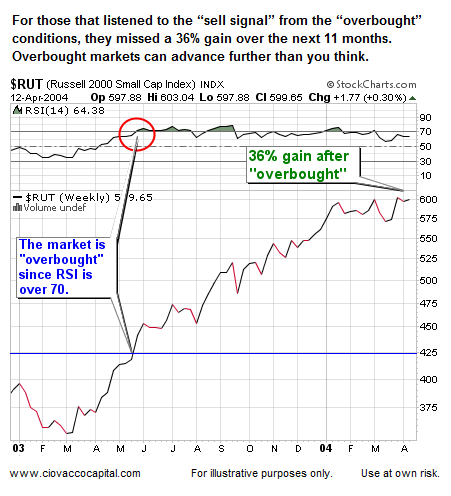
Another important thing to consider in today’s climate is an overbought market may in fact lead to some type of pullback, but it does not necessarily lead to the end of the opportunity to make money.
We have provided anecdotal examples of an overbought market that continued to rise using one indicator, the relative strength index or RSI. The CCM Bull Market Sustainability Index (BMSI) is based on thirty years of market data. It utilizes numerous technical indicators and tools and compares sixty-two sets of present day data with historical data. By comparison, most of the anecdotal emails we get reference one piece of data (vs. 62) over a six or twelve-month period (vs. 360 months with the BMSI). To gain an understanding of the broad scope of the BMSI, a logic flow table is available on the BMSI page.
Just how overbought is the current market relative to the BMSI and historical BMSI values? The table below shows the S&P 500’s performance (1980-2010) after periods when the BMSI fell into one of the ranges below. To create the BMSI, we studied both positive and negative outcomes, their relative frequency, and magnitude. When the risk-reward ratio drops below 1.0, it tells us historically the odds shifted against investors. Using risk-reward ratios takes into account there are no certainties with any market model or forecast, but rather probable outcomes which include potential gains as well as potential losses. The BMSI closed on February 2, 2011 at 3,745. Notice the risk-reward profile for stocks historically was favorable when the BMSI fell between 3,675 and 3,875 (see CURRENT below).
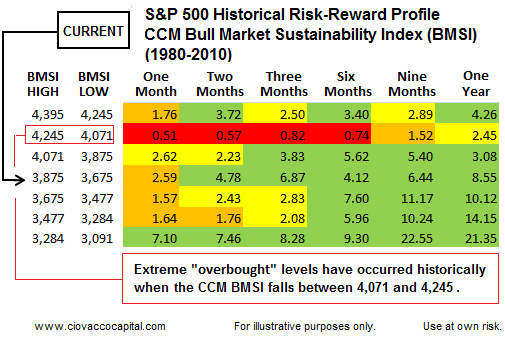
As mentioned above, we are not big fans of the term overbought, but as measured by the BMSI, which is based on 62 technical parameters over a thirty-year period, the S&P 500 becomes overbought from a risk-reward perspective when the BMSI falls between 4,071 and 4,245. The next logical question is what would need to happen in the 2011 markets to possibly move the BMSI into the 4,071 to 4,245 range? Numerically, the BMSI would need to add 326 to 500 points. In the remainder of this article, we highlight logical areas, including NYSE New Highs - New Lows, where the BMSI could pick up those points to push it into an unfavorable risk-reward zone. Below, we provide some recent anecdotal evidence related to the stock market’s behavior and this breadth indicator.
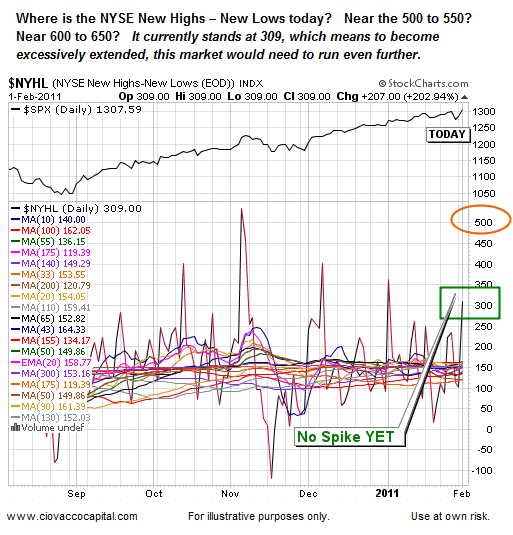
The BMSI includes NYSE New Highs - New Lows in six separate market tests that can add a maximum of 600 points to the index. The present day market could pick up an additional 400 points if the NYSE New Highs - New Lows continues to rise.
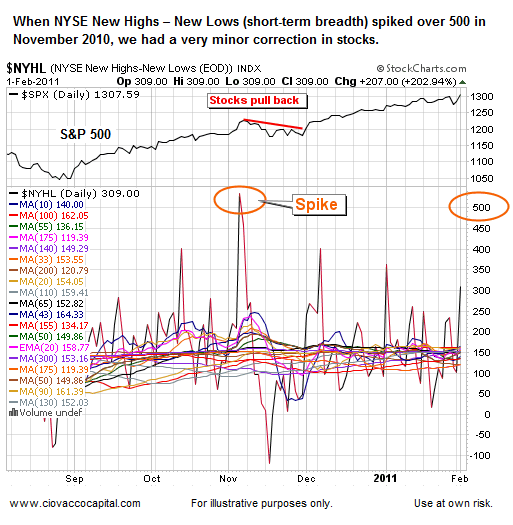
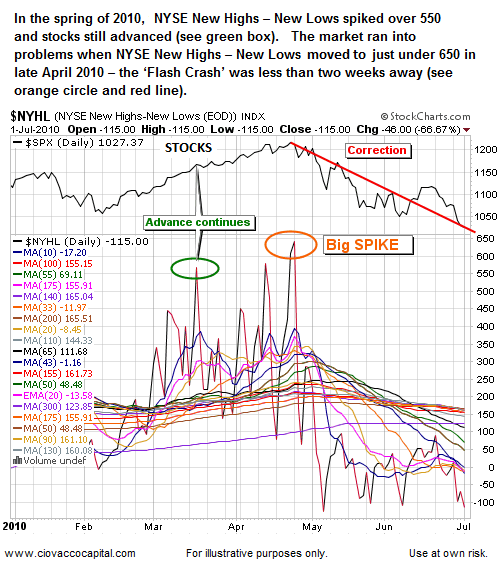
One area of the 2011 market that is not currently overextended relative to history is the NYSE New Highs – New Lows.
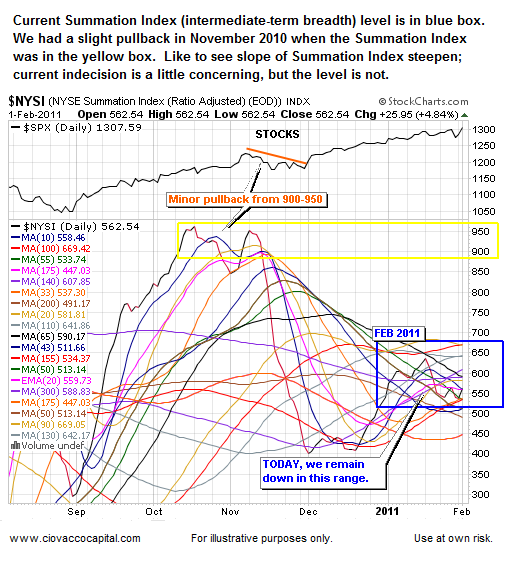
The Summation Index is a market breadth indicator derived from the number of advancing and declining stocks in a given market. The concept of breadth is easy to understand; healthy markets have broad participation during rallies. Healthy markets have a rising Summation Index.
The Summation Index can add up to 600 points to the CCM BMSI. Currently, it has picked up 400 of those points, leaving an additional 200 as a possibility should market breadth continue to march higher. Adding 200 points to the February 2, 2011 BMSI value of 3,745 would take us very close to 4,071, the low-end of the unfavorable risk-reward range for projected future stock market performance. Below, we provide some recent anecdotal evidence related to the stock market’s behavior and this breadth indicator.
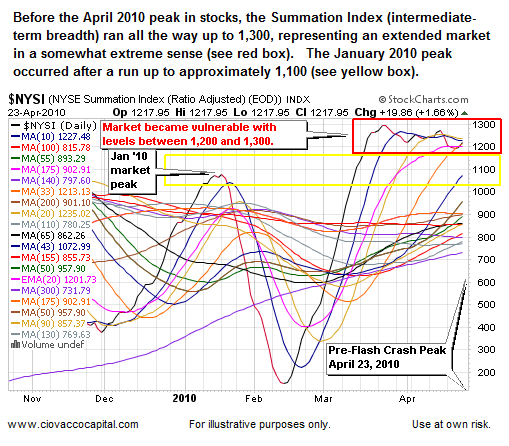
Keeping in mind the Summation Index hit levels of 1,100 and 1,300 prior to the January 2010 and April 2010 stock market peaks, the current level is not yet into ‘red flag’ territory.
If you are looking for a concerning chart to forward via email, here is one we are concerned about regardless of what the BMSI says (S&P 500 as of 2/2/11 close below):
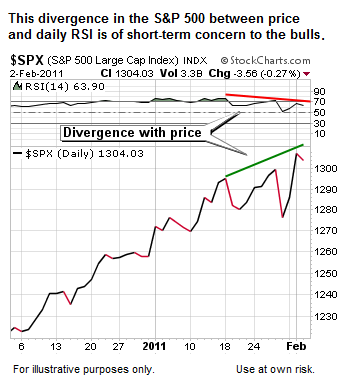
At this point, it would probably be easier for most market participants if stocks pulled back a little from present levels and moved toward oversold conditions. Unfortunately, the markets rarely make anything easy for any of us. While the current day market is showing some cracks, history tells us additional gains prior to a correction cannot be ruled out. Some key levels where a possible reversal in stocks could take hold are outlined in this Financial Sense post.


