


Despite weak economic data, most economists remain optimistic about a second half rebound in the economy. From Bloomberg:
Rising exports, stable fuel prices, record levels of cash in company coffers and easier lending rules will be enough to overcome the damage done by one-time events like poor weather and the disaster in Japan, economists said. Nonetheless, the current slackening means Federal Reserve policy makers will wait even longer to raise interest rates next year, the survey shows.
Markets are not currently aligned with the economists, at least in the short-term. The U.S. dollar remains the world’s reserve currency and still serves as a ‘safe haven’ in times of economic weakness or uncertainty. All things being equal, a strengthening U.S. dollar (UUP) tends to be a negative for stocks, commodities (JJC), and precious metals (GLD).
If market participants were anticipating the Fed to signal another round of quantitative easing or QE3 (see videos), we would expect the U.S. dollar to be weak and commodities/precious metals to be strengthening in a convincing manner. That is not what we have at the present time, which means aligning your portfolio for QE3 may be premature at this point.
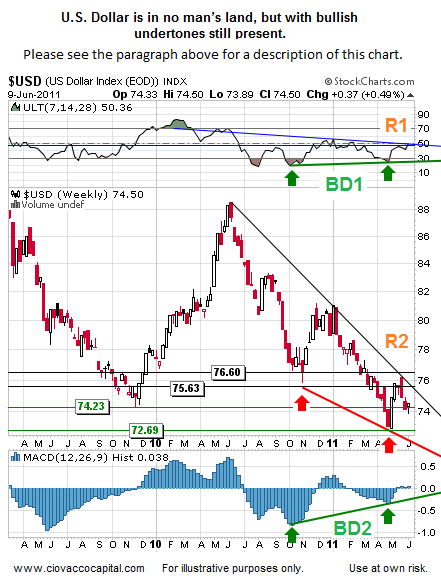
A bullish divergence occurs when price makes a lower low and a technical indicator makes a higher low, which indicates slowing downside momentum. Divergences on weekly charts are more important than those on daily charts.
The U.S. dollar recently experienced bullish divergences on its weekly chart – two are shown below. Notice how price made a lower low (see red arrows), while the indicators made higher lows (see green arrows). Bullish divergence is abbreviated BD in the chart below. All charts and analysis are as of the close on Thursday, June 9, 2011.
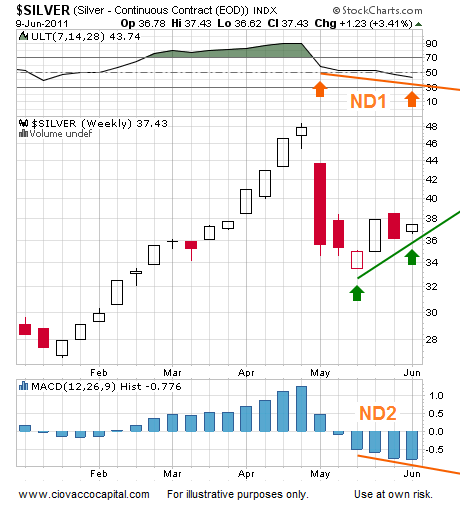
If you own stocks (SPY), commodities (DBC), or precious metals (SLV), you should be aware of the dollar’s current state and be somewhat concerned. The chart of silver below shows bearish divergences. A bearish divergence occurs when price is trending higher (see green arrows) and the indicators continue to decline (see orange lines). In the charts that follow, negative divergence is abbreviated ND. The chart below tells us to be patient in terms of considering buying back the silver we sold several weeks ago.
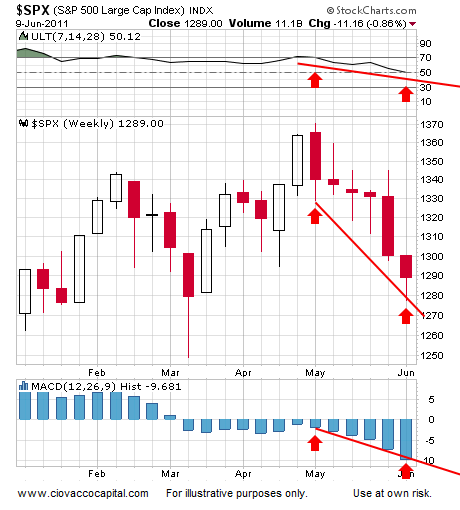
There are no bullish divergences present on the weekly chart of the S&P 500 Index (see below). Price is declining and the indicators are “confirming” the decline. This tells us to continue to err on the defensive side and to be in no big rush to redeploy our cash into stocks. We did not buy during the rally on June 9.
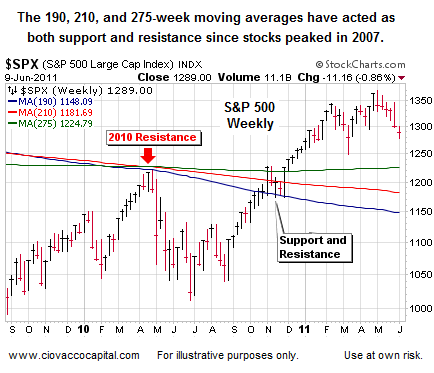
Late in 2010, we stated that a break above the moving averages shown below (green, red, and blue lines) would open the door to further gains in stocks, which is what indeed happened. If stocks should continue their current short-term downtrend, then we will look for buyers to possibly step in near the weekly moving averages shown below. The current levels to watch are 1,225, 1,182, and 1,148.
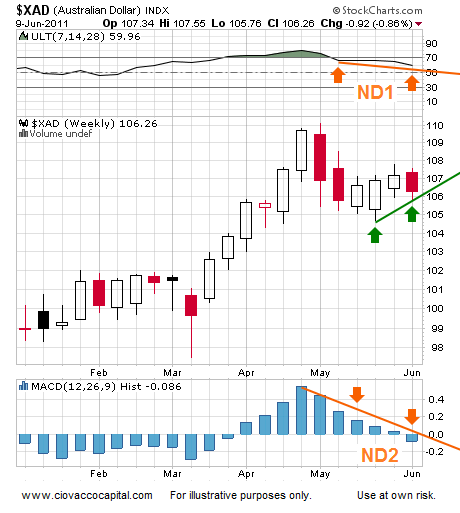
Shifting back to the currency markets, the recent rally in the Australian dollar (FXA) has not been confirmed by the indicators shown on the weekly chart below. We may consider cutting back on our holdings again soon.
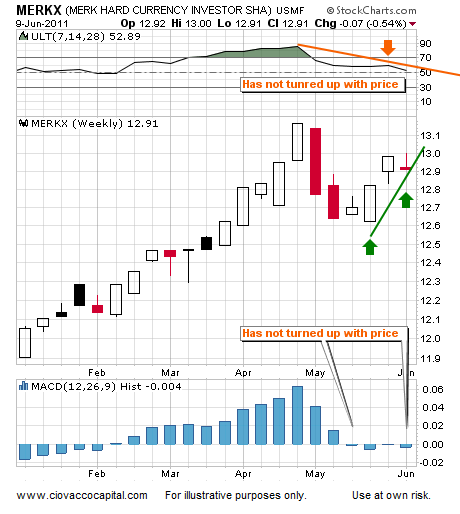
The Merk Hard Currency Fund (MERKX) is described by Merk as follows:
The Merk Hard Currency Fund seeks to profit from a rise in hard currencies versus the U.S. dollar. The Merk Hard Currency Fund typically invests in a basket of hard currencies. Hard currencies are currencies backed by sound monetary policy; sound monetary policy focuses on price stability.
We like the Merk Hard Currency Fund from a long-term perspective and often monitor it to better understand the general tone in the currency and stock market. The weekly chart of MERKX below looks relatively bearish with sluggish indicators not giving us a lot of confidence in the recent rally. Like strength in the U.S. dollar, weakness in MERKX tends to send bearish signals about stocks, commodities, and commodity related currencies, such as the Austrian dollar (FXA) and Canadian dollar (FXC). We may cut back on our somewhat limited exposure to MERKX.
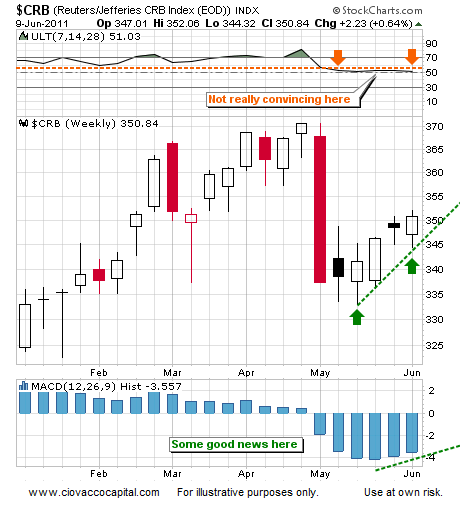
The one exception or mixed bag from a bull/bear perspective is the broad basket commodities. The weekly chart of the CRB Index looks a little better (not great) than silver, the Australian dollar, or S&P 500 Index.
How does all this help us? As long as the charts above remain in a similar state, it is prudent to continue to raise cash and manage risk closely. With the Fed in the background, we must keep an open mind about bullish developments. If the charts above improve, we may need to be nimble in terms of backing off our defensive stance. For now, the pressure is on our defensive coordinator – we have given our offensive coordinator some time off pending further developments.
Source: Ciovacco Capital


