


With the financial markets facing uncertainty about the balance sheets of banks and governments in Ireland, Spain, and Portugal, continued weakness in stocks, commodities, and precious metals remains a possibility. From a risk management standpoint, it is important for us to understand the possible downside risks in the short-to-intermediate-term. Since risk assets (stocks, commodities, precious metals) have been primarily driven by liquidity, their correlations have been strong since the 2010 summer lows. Therefore, the S&P 500 Index can be used as a proxy for all risk assets. If the downside risks are muted in stocks, they are also somewhat muted in commodities as well.
Due to the following factors, we continue to believe the downside risks in the stock market are manageable in the short-to-intermediate-term:
* Quantitative Easing (QE): The Fed plans to inject freshly printed money into the economy well into 2011, which will place upward pressure on the price of stocks, commodities, and precious metals. While it is beyond the scope of this study, if you are unclear of the potential impact of quantitative easing on asset prices, you can review these QE resources.
* Slow Economic Growth: The calls for a double-dip recession were common in the spring and summer of 2010. An objective review of the data never placed a double-dip as the high probability outcome. We will have to keep an eye on the incoming data, but it continues to support slow, but positive GDP growth. The global economy has numerous problems, but positive growth in global GDP can continue given what we know today (subject to change).
* Technical Support: Buyers and sellers and their trading algorithms tend to have long memories. This study focuses on long and short-term levels of support, trendlines, and Fibonacci retracement levels for the S&P 500 Index. The objective is to better understand where buyers may become interested should further corrective activity unfold in risk assets.
Summary of Results
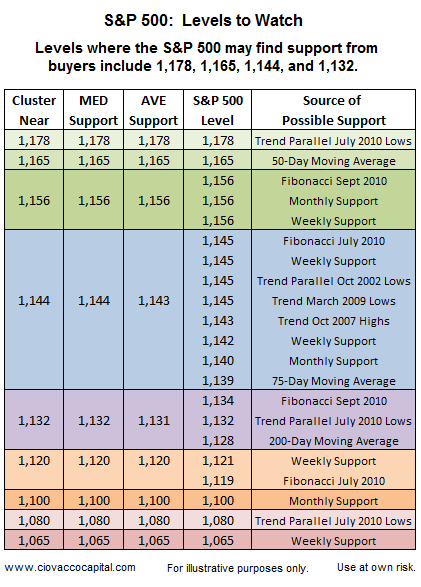
The table below summarizes the results of the S&P 500 support study. The values on the far left side of the table show where various forms of support for stocks tended to cluster. We would expect some buying interest in the S&P 500 near 1,178, 1,165, 1,156, 1,144, and 1,132. If these levels are breached, then the next areas of support clusters come in near 1,120, 1,100, 1,080, and 1,065. The level where we would expect to see the strongest conviction from buyers comes in near 1,144 on the S&P 500.
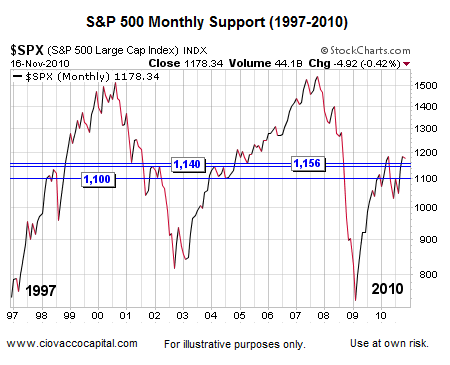
The eight charts of the S&P 500 below show how we compiled the table above. Traders and investors use various tools and examine various timeframes when making allocation decisions. Areas of potential support, or interest from buyers, are more meaningful when they appear in various timeframes and are determined using various methods. Below, we examined areas of past support and resistance on a monthly chart of the S&P 500 going back to 1997. Key levels clustered near 1,156, 1,140, and 1,100.
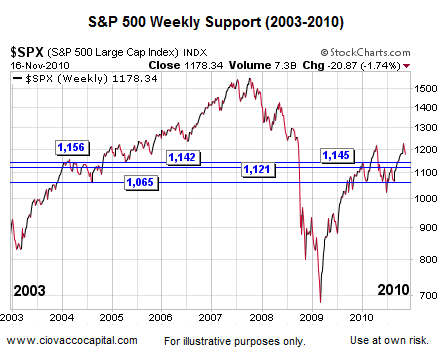
The weekly chart below allows us to look at a little more detail going back to 2003. Key levels tended to cluster near 1,156, 1,145, 1,142, 1,121, and 1,065.
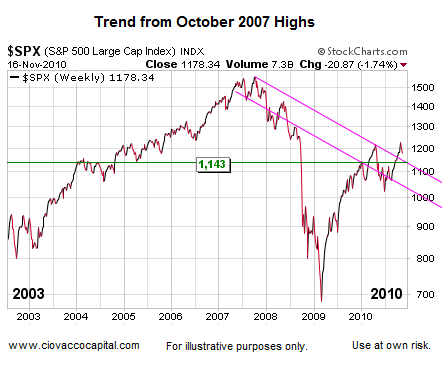
The chart below looks at parallel trend lines on the S&P 500 from the October 2007 highs. If the current day market were to fall further, it may find support from the top pink line near 1,143.
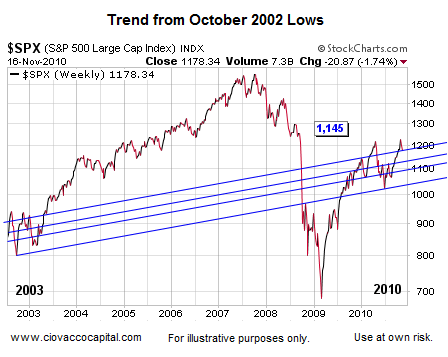
Below, we review parallel trendlines from the October 2002 lows. Notice how markets tend to have long memories relative to parallel trends. Possible support from the top blue line comes in near 1,178; the next line would come into play somewhere near 1,145.
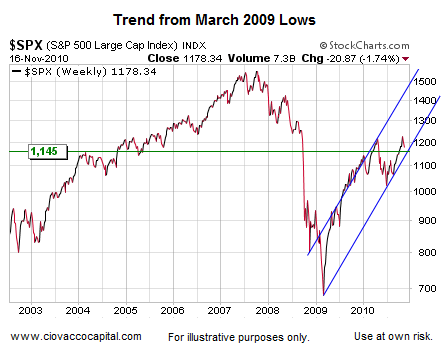
The chart below looks at the trendlines from the March 2009 lows. It appears as if the S&P 500 would intersect with the lower blue trendline somewhere in the neighborhood of 1,145.
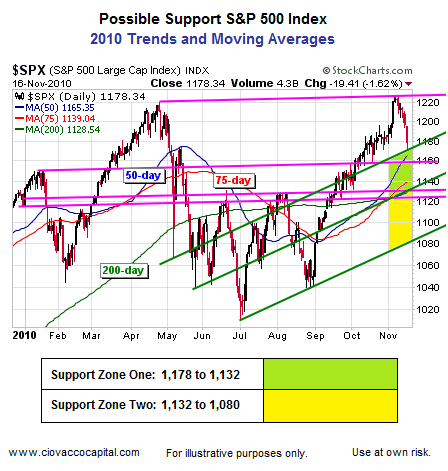
This chart (below) looks at a much shorter-term view. The green lines are parallel trendlines from the July 2010 lows. The pink lines are parallel trendlines connecting the April and November 2010 highs. Moving averages for the S&P 500 are shown via the blue, red, and green thin lines. This chart has two major zones of potential support highlighted in green and yellow. A break of the lower green trendline would be a cause for concern (currently near 1,080).
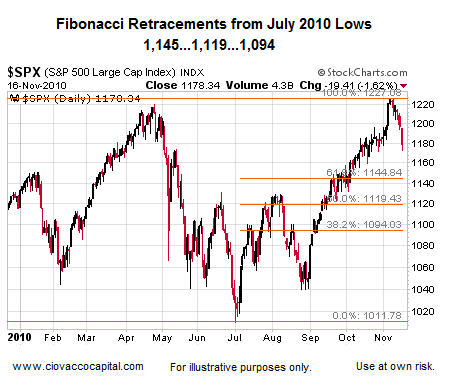
Traders often watch Fibonacci retracement levels; so it pays to keep these in your back pocket. The basic concept is all markets have natural ebb and flow where “giving back” some gains is a normal part of any healthy market. Retracements bring new buying interest and allow markets to move higher. The chart below shows the retracement levels for the gains made from the summer low to the recent fall 2010 high.
Below, are the levels using the more recent September 2010 low matched with the most recent high in the S&P 500.
The summary table at the top of this page aggregates the areas of possible support garnered from various timeframes and various methods. In the short-to-intermediate term, the key levels where buyers may become interested in risk assets correspond to S&P 500 levels of 1,156, 1,144, and 1,132. Trendlines, support, and retracements levels are violated commonly in all markets, which speak to the probabilistic nature of this analysis. A break of 1,144 on the S&P 500, especially on a weekly closing basis, would increase the odds that any pullback may be more than a normal correction within a healthy market. Developments in Europe and new fundamental data need to be factored into all investment decisions, and should be used in conjunction with possible areas of buying support.


