


My all-time favorite movie by far has to be Braveheart released in 1995. My Father and I both saw it several times in the movie theaters and the film went on to win the Academy Award for Best Picture and Best Director. The movie was filmed with many vivid scenes and the one that comes to mind is when the English cavalry were bearing down on William Wallace (Mel Gibson) and his fellow Scots.
The theater would reverberate with the subwoofers as the movie showed the cavalry approaching in slow motion as the hooves would hit the ground. You could feel the tension as the horses drew nearer all the while William Wallace shouts, “HOLD… HOLD… HOLD.” Wallace didn’t want his men to raise their spears too soon for doing so would alert the cavalry of the trap they were about to face of being impaled on the spears. Using the scene as an analogy for investors, the approaching cavalry is the fear of missed opportunity by not being invested. The scene aptly describes what my stance would be on the markets, “HOLD… HOLD… HOLD!”
My gut tells met that we are going to get some kind of economic response from all the mud being thrown at the wall by both the Fed and Treasury; at some point some of the mud is going to stick and the markets will be discounting this months ahead of time. I’d wager that the earliest the recession will end will be late in the third quarter to the end of the fourth quarter, with my gut leaning towards November or December. The S&P 500 bottoms prior to the conclusion of a recession on average of six months and taking the November bottom would imply that the market is anticipating the recession to be over by May which I highly doubt, with a bottom in March to June more likely.

The above excerpt was from an article I had written on January 28th 2009(In the Word’s of William Wallace: “HOLD...HOLD…HOLD). At the time I was beginning to see signs that we were nearing an end to the 2007-2009 bear market and that we were going to get an economic bounce eventually with the markets discounting that improvement in advance. While I was seeing some positive improvements in the market and economy I did not yet feel that the bear market was ready to loose its grips and that there was still some downside risk to the markets. Flipping my January 2009 analysis and analogy on its head, “the approaching calvary is the fear of an approaching bear market and being fully invested.” Again, my stance would be, “HOLD…HOLD…HOLD.”
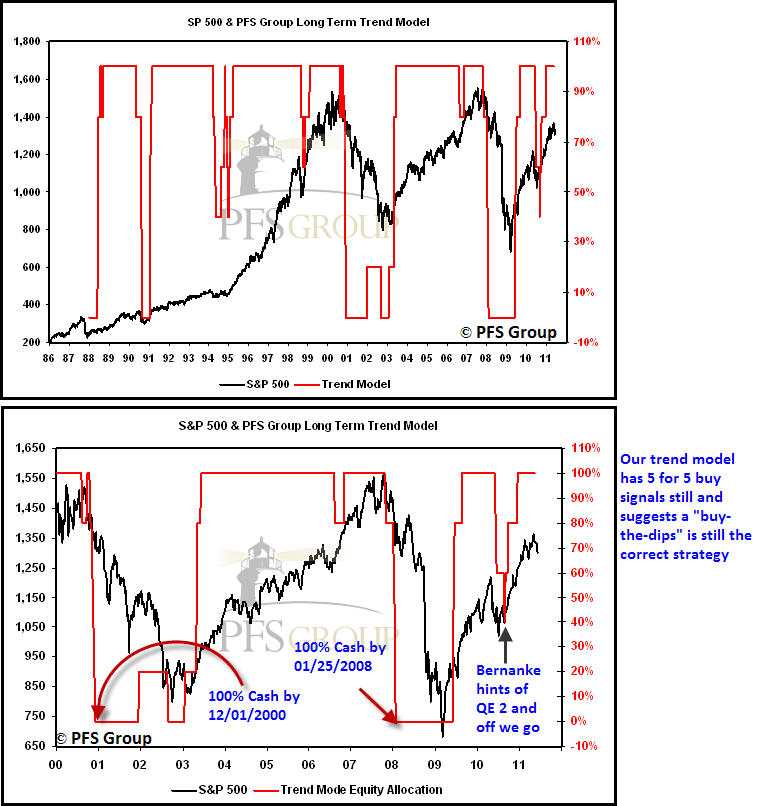
In contrast to what I saw in January 2009, while there are some cracks in the bull market and economy, I still think it is too early to declare an end to the 2009-present bull market. For starters, our S&P 500 Long Term Trend Model which is composed of five different signals are all still on a buy. There simply has not been enough deterioration in the market to suggest a bear market is underway. The model is not designed to generate sell signal ahead of a market peak to prevent whipsaws, but instead is designed to generate sells near or just after a market top. For example, our model suggested 100% cash by 12/01/2000 and 100% cash by 01/25/2008. It is by no means perfect and will get whipsawed by corrections that are severe but not enough to generate a bear market (20%+ decline). For example, the model suggested a 40% equity allocation and 60% cash in 1994 but thanks to Greenspan cutting interest rates and goosing the money supply the markets vaulted higher and a bear market and recession was avoided. Likewise, by last summer the model again suggested a 40% equity and 60% cash allocation but Greenspan’s successor, Fed Chairman Bernanke, hinted of QE2 in August 2009 that sent the markets and risk assets higher. With the model still suggesting a 100% equity allocation, there simply hasn’t been enough deterioration in the markets to get overly bearish YET.
Source: Bloomberg
As stated, while there are some definite cracks in the bull market, the bulls are still in control as there has been no handoff of control between the bulls to the bears. This handoff is a hallmark of major market turns and can be identified by major spikes in either new 52-week lows in terms of an approaching bear market or a spike in new 52-week highs as a new bull market begins. To see what I am referring to, below is a figure of the NASDAQ composite on top and in the bottom panel is the percentage of stocks on the NASDAQ making new 52-week highs and lows. Back in 2003 new highs surged to signal a momentum kickoff to a new bull market. The bulls remained in control for the following four years until a major spike in new lows in 2007 occurred to signal a momentum kickoff to a new bear market as the bulls handed over control to the bears. Like 2003, a major spike in new highs in 2009 signaled a momentum kickoff to yet another new bull market as the bulls wrested control from the bears. Looking at the level of new highs and new lows in the NASDAQ over the last year shows that the bulls are still in the dominate position.

Source: Bloomberg
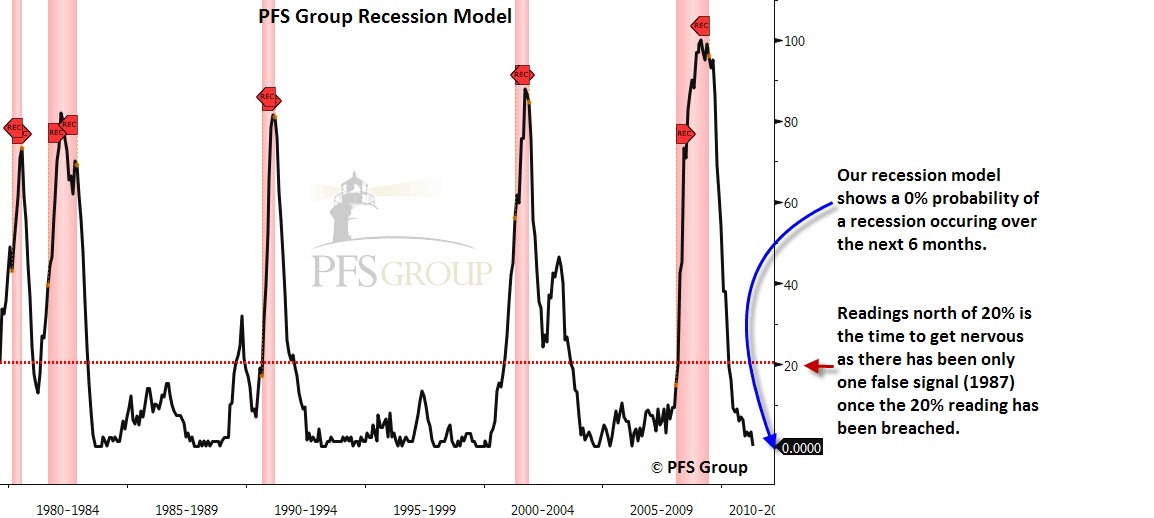
As we have not seen enough deterioration in the markets to suggest a bear market, we have also not seen enough deterioration in the economy to suggest a recession is right around the corner. In fact, our recession model suggests a 0% probability of a recession occurring in the next six months and is well below the 20% threshold that has provided an early warning of a recession in all but one case over the last three decades. Given that recession risk remains low it is not surprising to see the equity markets still holding up and the bulls in the drivers seat. (Note: recessions shown by red bars).
Source: Bloomberg
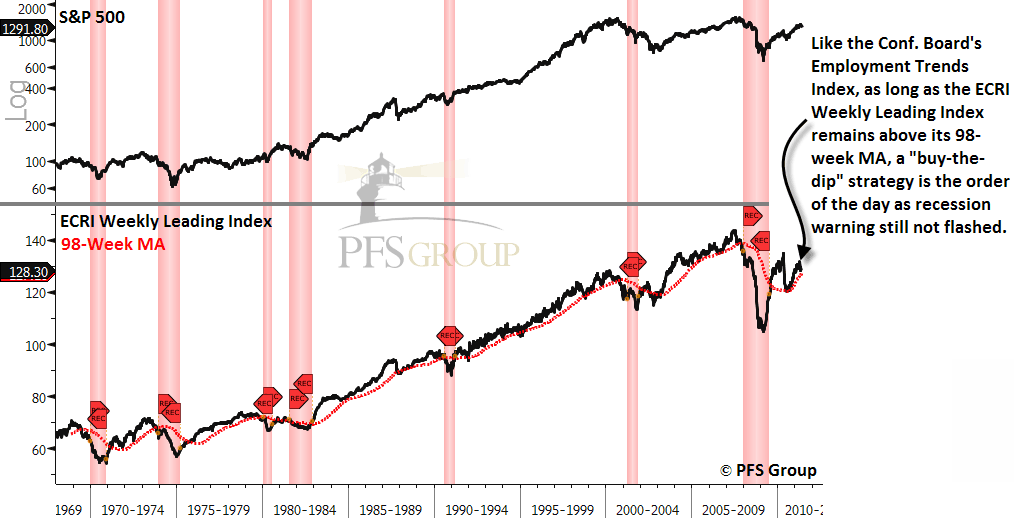
Further validating our recessionary risk model is the Conference Board’s Employment Trends Index (ETI) and the Economy Cycle Research Institute’s (ECRI) Weekly Leading Index (WLI). Shown below is the S&P 500 on top and the Conference Board’s ETI below along with its 20-month moving average (20-Mo MA). The ETI typically falls below its 20-Mo MA well in advance of a recession with few false signals and looking at it its present situation shows it is still above its 20-Mo MA and not signaling a risk of an approaching recession. The same is true for the ECRI’s WLI which often falls below its 98 week moving average (98-W MA) prior to the onset of a recession. While the WLI has fallen recently just like the ETI, it has yet to fall below its key moving average which indicates there has not been enough deterioration in the economy to raise any recessionary flags.

Source: Bloomberg
Source: Bloomberg
In short, just as I saw bullish signs to suggest that the 2007-2009 bear market was coming to a close but not quite yet, I see some bearish signs which indicates the present bull market is beginning to show its age but do not yet feel a bear market has begun and that the bulls remain in control. This thesis is supported by our S&P 500 trend model which suggest a 100% equity allocation and our recessionary risk model which suggest a 0% probability of a recession in the next six months. Other indicators like the Conference Board’s Employment Trends Index and the ECRI’s Weekly Leading Index has lent creedence to the bullish case as there isn't sufficient evidence to make a bear market call. That said, if the market continues to deteriorate further our trend model will flash sell signals as the bear case will become more valid, but rather than jump the gun our discipline in following our unemotional models suggest investors “HOLD….HOLD…HOLD.”


