


What a wild and crazy week! Thanksgiving trading week was one of the worst Thanksgiving weeks in more than a half century. This was followed up by this week’s 7.4% rally in the S&P 500, the largest up week since March 2009 at the end of the last bear market. With volatility like this, sometimes the best way to make sense of all the market noise is to take a step back and look more at long term trends and movements rather than the day-to-day noise. As of now, we still do not have any long-term buy signals which suggest the bulls have more work to do as we close out the year.
Record Volatility
Let's face it: the market is being tossed around like a ship in a hurricane. In terms of actual points, my friend Brian Pretti from ContraryInvestor.com sheds some illuminating details:
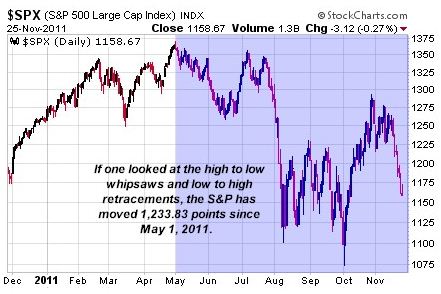
To suggest financial markets have been volatile as of late is simply a wild understatement. Although we've certainly seen this type of volatility in terms of percentage moves over short spaces of time in the past, we can't remember when we've last seen this degree of volatility within the context of whipsaw back and forth movement. Although it may sound hard to believe, if one looked only at closing S&P prices and added up the interim high to low and low to high movements of the SPX since literally May 1 of this year, the S&P has traveled 1,233.83 points!!!! More than the entire value of the SPX as of the close the day after Thanksgiving. Now how's that for volatility over a seven month period?
Clear the Mechanism
Two years ago we were treated to many investment commentators that suggested the market was due to peak and that we were heading into a recession in early 2010. Rather than dealing with every bull or bear market case I suggested listening to the collective message of a few long term market signals and how our long-term equity model for the S&P 500 was still improving and receiving more and more buy signals. When I penned my article two years ago (Clear the Mechanism) our trend model for the S&P 500 had three of four signals on buys (we have since added a fifth indicator), which suggested a target equity allocation of 75%. Based on the model’s message I made the following comments:
Clear the Mechanism
Ignoring market commentary and opinions and listening to the simple message of the four risk indicators highlighted in the beginning of the year (Priority #1: Risk Management) shows that the market message is still bullish as three out of the four indicators are still flashing buy signals and the fourth signal is close to giving its own buy signal. “Clearing the mechanism” says the bulls still have the upper hand, though the market is presently overbought and may need to correct first before heading higher.
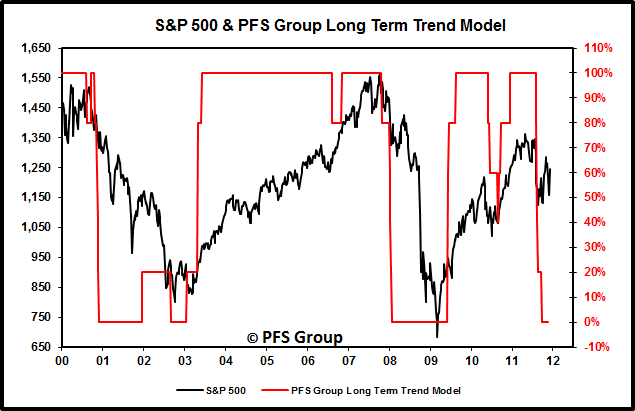
While two years ago I summarized the message of our model in staying bullish, the current message of our model continues to overwhelmingly suggest caution as all five indicators are still on sell signals. As seen below, the model slowly begins to generate buy signals after a recession (1991, 2001, and 2009) or financial crisis (1998 Asian Currency Crisis/LTCM, 2010 Euro Crisis). However, despite the market’s rally since October’s low we have yet to receive a single buy signal, which clearly shows the bulls have more work cut out before the all clear is given for the markets.

Source: Bloomberg
Source: Bloomberg
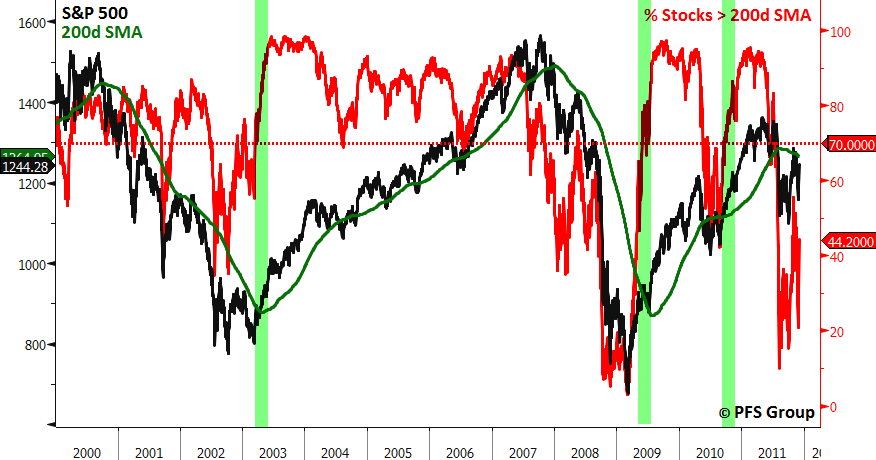
Another solid way of looking at the overall stock market is by the S&P 500 in relation to its 200 day moving average (200d MA). Typically, a new bull market is signaled when the S&P 500 is 1) comfortably above its 200d MA and 2) the percentage of stocks within the S&P 500 above their 200d MAs is greater than 70%, indicating a broad-based market advance. In the chart below you can see how effective these two conditions are in signaling market direction. For example, the first time we saw them occur was in mid-2003, providing a signal that a new bull market was underway. Likewise, the same was true during the 2007-2009 bear market where the first buy signal was given in mid-2009. Even last year’s market route witnessed both conditions being met when the can in Europe was kicked down the road a bit further and the markets advanced to new highs. As of right now, the S&P 500 is still below its 200d MA and we only have 44.2% of S&P 500 stocks above their own 200d MAs. So, once again, until both the S&P 500 and more than 70% of its members are above their 200d MAs, caution still remains the better part of valor.
Source: Bloomberg


