


With the equity market rally over the past two weeks our long term and intermediate surveys improved slightly but continue to remain in neutral to bearish territory and suggests the market has either more downside or further healing ahead before the outlook turns bullish.
* Note: For further explanation of the market surveys and background on analysis, please click here.
200 Day Moving Average Evaluation
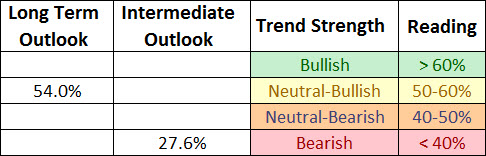
As shown in the table below, the net percentage of stocks that are in long term uptrends increased from the prior week from 49% to 54% while the percentage of stocks in downtrends decreased from 49% to 46%. The increase to 54% bumps the markets long term trend from Neutral-Bearish to Neutral-Bullish. In terms of sectors, the utility sector takes the top spot as the percentage of its members in uptrends increased to 81% while the health care sector takes the second spot with its 77% reading. The absolute worst sector remains energy with only 23% of its members in long term bullish trends. Given energy represents 11.3% of the S&P 500, its weakness is weighing on the S&P 500 and offsetting some of the improvement in utility and health care sectors.

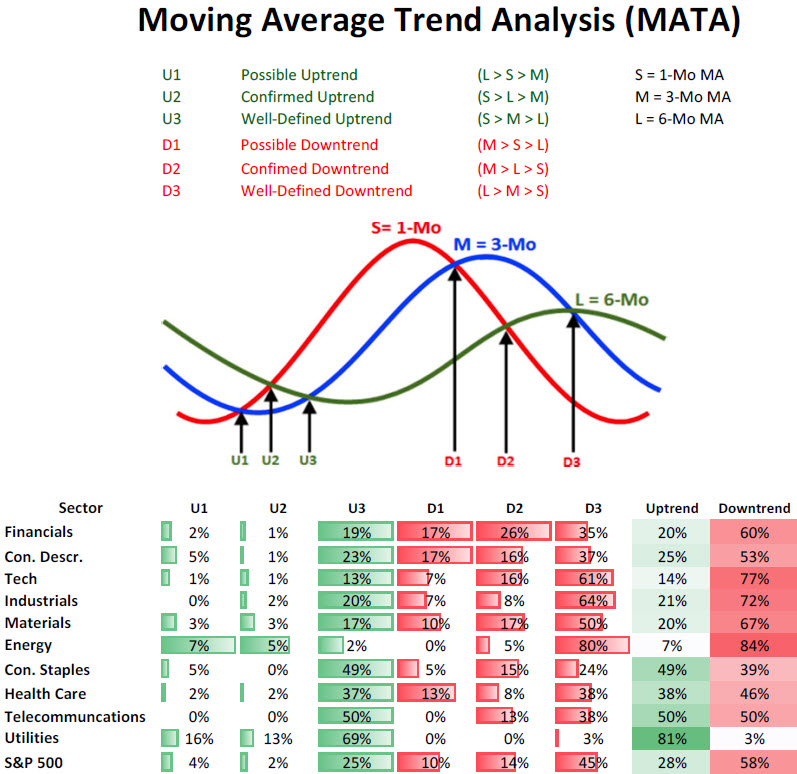
Moving Average Trend Analysis (MATA)
We saw a further improvement in the MATA survey for the S&P 500 in which the percentage of stocks in uptrends increased from 22% to 28%. We saw a decrease in the percentage of stocks in intermediate downtrends from 62% to 58% from last week’s reading as many stocks that were trendless are starting to find their bullish footing.
At a reading of 28% the intermediate trend for the market is now deep into negative territory and at a level where we often see intermediate bottoms. This is also shown when looking at the McClellan Summation Index which is at levels associated with intermediate lows. If we are to repeat the 2010 and 2011 cycles we should see a relief rally followed by a renewed decline to new lows on less negative breadth to setup bullish divergence with the Summation Index, followed by a strong recovery. Whether we repeat the 2010/2011 pattern or not, for a sign that the bullish trend is resuming we need to see a strong bullish move in breadth north of the 2800 reading on the Summation Index. This is what has occurred in the bullish advances since 2006 and at a reading just barely north of 1000, we need to see much stronger breadth before the all-clear is given.

Source: Bloomberg
52-Week Highs and Lows Data
The data for the S&P 500 for 52-week highs and lows shows a market where the remains very defensive as the bulk of new 52-week highs are coming from defensive sectors such as utilities, telecommunication services, and health care. Strong markets witness new 52-week highs in cyclical sectors like financials, consumer discretionary, and technology, which make up the bottom of the pack in terms of new 52-week highs (see lower portion of figure below).

Source: Bloomberg
Summary
Given the above, the message provided in the surveys is an intermediate-term correction that has significantly weakened the longer-term trend of the market and at best we are in the middle of a trading range and at worst working off oversold conditions before resuming another decline. On the bullish side of the ledger, this intermediate correction is running out of time as most intermediate-term moves end between 20-30 days and we can expect some type of oversold rally to occur to alleviate the market’s oversold condition, which is also the message from the McClellan Summation Index. If we are to repeat the 2010 and 2011 script we should see a relief rally that fails followed by new price lows in the market which occur with fewer and fewer stocks participating on the downside to setup a bullish divergence with breadth followed by a sustained move higher. Regardless of how the market zigs or zags, we need to see the McClellan Summation Index rise above the 2800 level to have any confidence that a low has been made. Until that occurs the market is likely to favor defensive sectors and bonds over cyclical sectors.


