


The cyclical sectors of the market have been weakening over the last few weeks while defensive sectors have strengthened, a sign of sector rotation that typically occurs prior to market tops. Additionally, there were a few canaries in the coal mine beginning to sing as highlighted two weeks ago that suggested a short term top was in the making. It looks like February 19th was a top in the market and a much needed correction to work off bullish sentiment and overbought technical readings is underway.
S&P 500 Trend Strength
* Note: Numbers reflect the percentage of members with rising moving averages, 200d MA is used for long term outlook, 50d MA is used for intermediate outlook, and 20d MA is used for short term outlook.
Canaries in the Coal Mine Keep Singing
As highlighted a few weeks ago (article link), junk bond prices and European equities were diverging from the S&P 500 and began to correct from their recent highs. This is significant as the two series often lead turning points in the S&P 500 and suggested caution was warranted. An updated version of the chart from my previous article is shown below along with a third canary, the USD Index (shown inverted in bottom panel below for directional similarity). As seen in the following chart, junk bonds and European equities remain weak while the USD continues to strengthen. For signs of a bottom we need to see the canaries stabilize and diverge with the price of the S&P 500 and the USD begin to weaken.
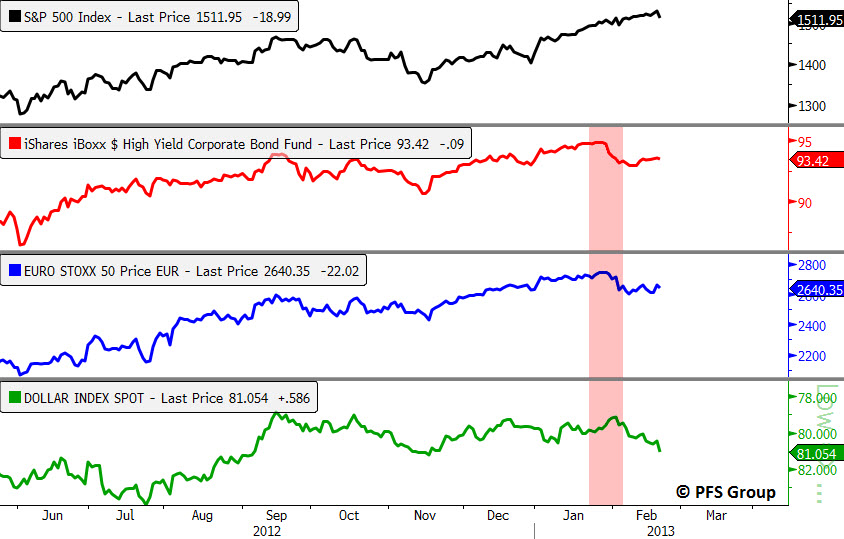
Source: Bloomberg
S&P 500 Member Trend Strength
Breaking out the 500 stocks within the S&P 500 into their respective sectors and viewing their long (200d SMA) and intermediate trends (50d SMA) shows the defensive sectors surfacing as short-term leaders as they possess the strongest short-term breadth (% of members above their 20 day moving average). The most important section of the table below is the 200d SMA column which sheds light on the market’s long-term health. As seen in the far right columns, you have 75% of the S&P 500 members with rising 200d SMAs with 84% of its members above their 200d SMA with all ten sectors in bullish territory as at least 60% of their members have rising 200d SMAs.
In terms of the market’s short-term view, we can see that the materials sector is showing the greatest weakness with only 23.3% of its members above their respective short-term moving averages (20d). The defensive utility and consumer staples sectors are market leaders with 80.6% and 78.6% of their members above their 20d SMA.

Source: Bloomberg
Market Momentum
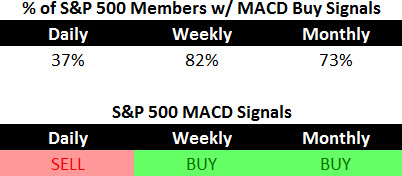
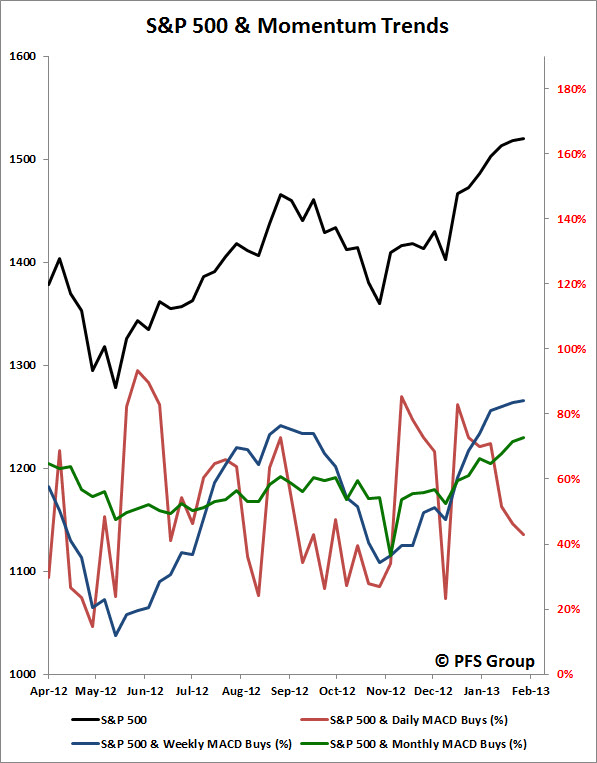
The Moving Average Convergence/Divergence (MACD) technical indicator is used to gauge the S&P 500’s momentum, on a daily, weekly, and monthly basis for short, intermediate, and long term momentum evaluation. Compared to last week, the percent of stocks within the S&P 500 with daily MACD BUY signals continued to weaken from 43% to 37%.
The intermediate momentum of the market weakened slightly from 84% to 82%, but remains firmly in bullish territory. Further evidence that there has been no dent in the markets longer-term outlook is the slight improvement with the percent of S&P 500 members with monthly MACD BUY signals increasing from 71% to 73%.
In addition to the deterioration in the percent of S&P 500 members with daily MACD buy signals, the S&P 500 Index itself is on a daily sell signal, the first sell signal since the end of December.
52-Week Highs and Lows Data
We have a well-represented market rally as nearly one third of the entire S&P 500 hit a 1-year high in the last five days. As seen below, we have a very robust market rally on our hands and there is very little red below. That said we are seeing a shift in the sectors that are hitting new highs. Health care, consumer staples, and financials continue to be well represented but we have seen a drop off in the industrial and consumer discretionary sectors, both considered cyclicals.

Source: Bloomberg
Taking a historical look at 52-week highs and lows we see that 52-week lows remain absent while 52-week highs continue to remain strong. While we are overbought and likely just starting a pullback, I would expect any pullback to be mild in nature and unlike the two corrections in 2012 as we are not seeing the same degree of negative divergences in new 52-week highs now as we did leading up to those two tops.

Source: Bloomberg
Summary
The market continues to march higher in 2013 as the short-term to long-term trends and momentum for the S&P 500 remain bullish. The continued deterioration in the daily readings for MACD BUY signals, deterioration in short-term trend strength in cyclicals, as well as the canaries in the coal mine highlighted above, suggest the market may cool off a bit ahead to help alleviate the market’s overbought condition. After a period of cooling off the market could possibly hit new highs as the intermediate and long term outlook for the markets continue to strengthen.


