


The markets continue to march higher and remain resilient to any news out of Europe regarding Cyprus. That said, we are seeing a loss in momentum and weakening in breadth measures that suggest caution as we may be treated to the market’s first real pullback for the year. Even then, the short to long-term outlook still remains in bullish territory and suggests any pullback should be mild in nature.
S&P 500 Trend Strength
* Note: Numbers reflect the percentage of members with rising moving averages, 200d MA is used for long term outlook, 50d MA is used for intermediate outlook, and 20d MA is used for short term outlook.
S&P 500 Member Trend Strength
Breaking out the 500 stocks within the S&P 500 into their respective sectors and viewing their long (200d SMA) and intermediate trends (50d SMA) shows the defensive sectors are surfacing as short-term leaders as they possess the strongest short-term breadth (% of members above their 20 day moving average).
The most important section of the table below is the 200d SMA column which sheds light on the market’s long-term health. As seen in the far right columns, you have 88% of the S&P 500 members with rising 200d SMAs and 86.8% of its members above their 200d SMA. This means all ten sectors are in bullish territory. While defensive sectors like consumer staples and utilities have the strongest short-term breadth (% members > 20d SMA), the cyclical sectors like financials and industrials are still showing the strongest long-term breadth with 96% and 97% of their members possessing rising 200d SMA respectively.

Source: Bloomberg
Market Momentum
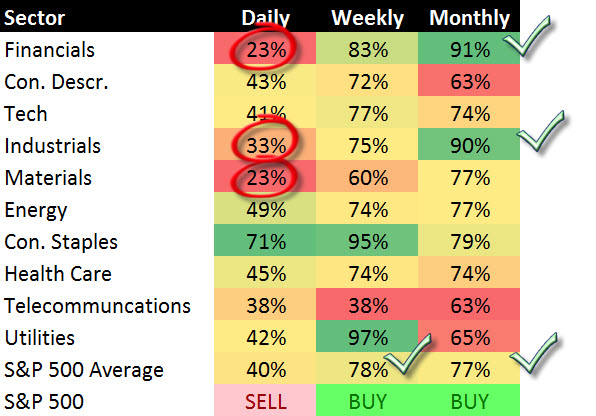
The Moving Average Convergence/Divergence (MACD) technical indicator is used to gauge the S&P 500’s momentum, on a daily, weekly, and monthly basis for short, intermediate, and long term trends. The daily momentum for the market continues to deteriorate as the percent of stocks within the S&P 500 with daily MACD BUY signals rests at 41% currently.
The intermediate momentum of the market remained steady at a strong 78% reading this week though it has declined from its peak in February. As seen in the chart below, it appears the weakening daily momentum is spilling over into the market’s weekly momentum.
With the above in mind, there has been no dent in the markets longer-term outlook as there was slight improvement with the percent of S&P 500 members with monthly MACD BUY signals rising to 77%.
As seen in the lower table, the S&P 500 itself is currently on a Daily MACD SELL signal while its weekly and monthly signals remain in BUY positions.


Source: Bloomberg
Looking at daily to monthly MACD signals for sectors shows that the cyclical sectors are responsible for most of the S&P 500’s loss in Daily momentum as the financial, industrial, and material sectors remain in the low 20% to 30% sell signal range. Although this type of activity is most commonly seen before a market pullback, its important to look at the monthly MACD signals to gain context on the longer market trend. For example, if we look at the cyclical sectors we notice they have the best long-term momentum with 91% of the financial sector having monthly MACD BUY signals and the industrials at 90%. This tends to suggest that if we do get a correction it should be primarily a pullback in a bullish trend rather than a significant top. For a significant top to occur we would like see the cyclical sectors showing the greatest erosion in monthly MACD BUY signals which is not occurring at this time.
52-Week Highs and Lows Data
Over the last 5 trading days we’ve seen nearly a fourth of the S&P 500 members hit 52-week highs which is a solid reading. However, three of the top four sectors leading the 52-week ranks are defensive sectors which isn’t surprising given the loss in daily momentum by the cyclicals with fewer daily MACD BUY signals as highlighted above. The fact that the defensive sectors are leading the charge higher puts the market’s advance to new highs on shaky ground.

Source: Bloomberg
Mulit-Indicator Summary
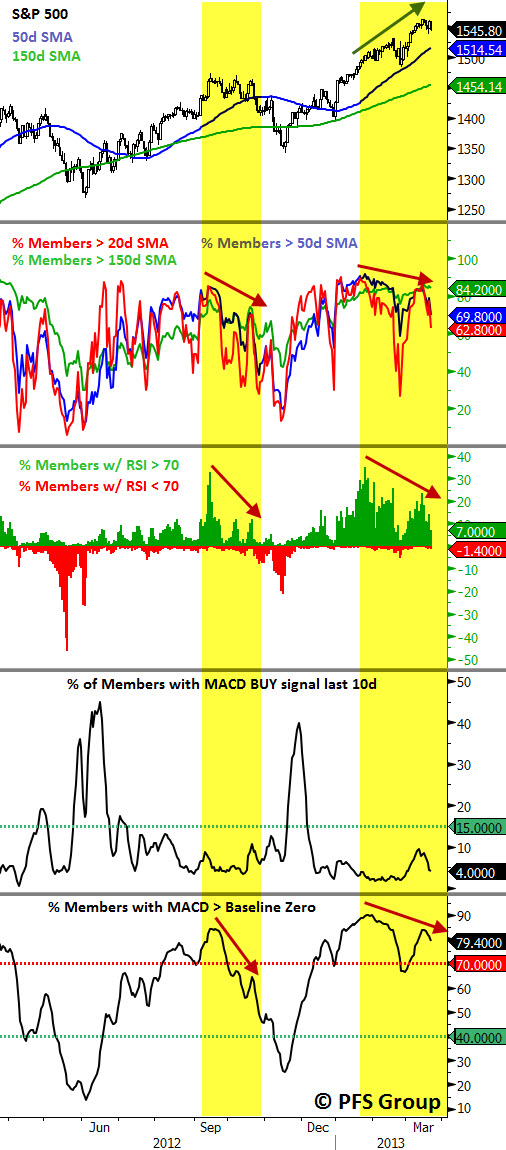
As seen in the multi-indicator chart below, we see negative divergences in the percent of members above the 20-day (red line) and 50-day (blue line) moving averages in the second panel, negative divergence in the percent of members with an RSI reading greater than 70 (third panel), and the percent of members with MACD lines above zero (fourth panel). This negative divergence setup is what we saw prior to the September-November correction in 2012.
Source: Bloomberg
Summary
The market continues to march higher in 2013 as the market’s long-term breadth and momentum remain strong across nearly every sector. However, the weakening in the daily numbers for breadth and momentum, particularly in the cyclical sectors, suggests near-term caution as we may be in store for a pullback similar to September-November of 2012. Given the long-term trend of the market is firmly in bullish territory, any pullback is likely to be in the context of an on-going bull market.


