


The title for today’s article comes from a book written in 1929 by Erich Maria Remarque, a German veteran from WWI. The main theme from the book is given below from Wikipedia:
One of the major themes of the novel is the difficulty of soldiers to revert to civilian life after having experienced extreme combat situations. Remarque comments in the preface that "[All Quiet on the Western Front] will try simply to tell of a generation of men who, even though they may have escaped shells, were destroyed by the war." This internal destruction can be found as early as the first chapter as Paul comments that, although all the boys are young, their youth has left them.
Investors globally can relate as they too have been bombarded by financial crisis shells ever since 2008, first with the U.S. subprime crisis then with the ongoing Greek saga and greater Eurozone, and finally the U.S. debt ceiling debate last summer. Separating these ongoing financial flare ups are periods of temporary respite in which central banks wave their monetary white flags and venture onto the battle field in their quantitative easing ambulances and help lift wounded oversold stock markets off the battle field and foster strong rallies. During these periods of respite investors display a great deal of timidity to venture back into the markets after just seeing their portfolios shelled by the cannons of financial instability.
However, taking an objective weight-of-the-evidence approach to analyzing the markets and economy can provide clues to see if it is still “All Quiet on the Western Front” or if another financial battle is about to be waged. When surveying the U.S. economic landscape it appears the former has been true ever since last fall, though the ringing from the guns of the East (Europe/China) can still be heard. As long as they remain at bay and things remain quiet on the U.S. Western Front, global investors should still have several more months of a temporary reprieve ahead in which they may emerge for a time to enjoy the sun and tack on some gains to their portfolios before returning to their investment bunkers as the financial sirens blare once more.
A Look at Labor
One of the main catalysts for the recent selloff in the markets was the disappointing nonfarm payrolls for March which came in at 120K, well below the consensus call for 205K jobs. However, the ADP employment figures for March actually came in at 209K, above the nonfarm payroll consensus view. One of the downsides to the Bureau of Labor Statistics (BLS) nonfarm payroll report is its volatility and use of models while the ADP report is far less volatile and currently paints a bullish picture as it is near the upper end of the job creation levels seen in the 2001-2007 economic expansion.
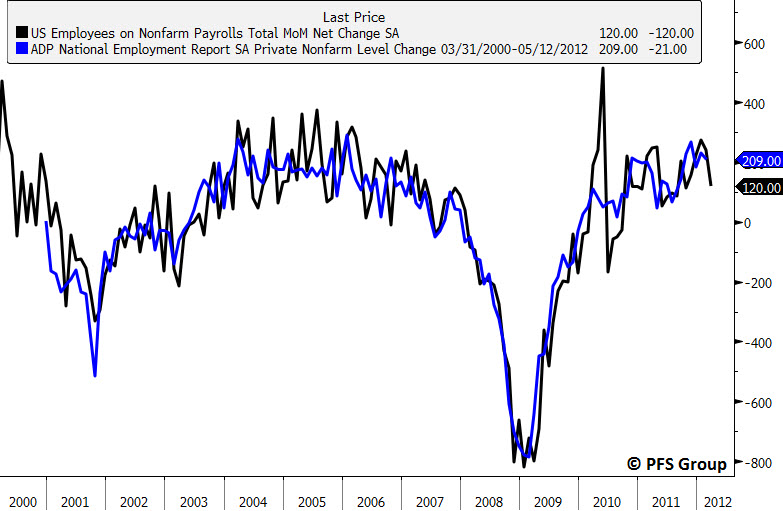
Source: Bloomberg
Other labor statistics also paint a bullish picture as seen by the BLS’s Job Openings and Labor Turnover survey. The data for February showed 3.498 million job openings and continued its uptrend that began in 2009. This is significant as job openings lead overall payroll levels by six months and suggests payrolls should continue to expand well into the second half of the year. Using the correlation between the two series since 2008 suggests payrolls should rise from the current 132.821 million to roughly 134 million by August, or 1.179 million jobs which works out to 235,800 jobs a month over the next five months.

Source: Bloomberg
Other labor statistics also support a bullish economic backdrop as seen by the initial jobless claims. The annual rate of change in the smoothed jobless claims data always spikes leading into a recession with the 15% mark often serving as bookends for recessionary periods. Given jobless claims are still declining at an -8.9% annual rate, we need to see a significant pickup before we start worrying about the jobs picture and economy.

Source: Bloomberg
One final piece of labor data also suggests a bullish outlook for employment, which is the National Federation of Independent Business (NFIB) Hiring Plans Index. This index leads the unemployment rate by four months and its smoothed advance (shown inverted below) suggests the unemployment rate should continue to decline through the summer months ahead.

Source: Bloomberg
Economic Indicators
In September of last year the Economic Cycle Research Institute, the leading business cycle experts, came out and made a call for a U.S. recession:
At the time the firm’s Weekly Leading Index (WLI) was deeply in negative territory often associated with recessions. However, within weeks of their recession call their WLI bottomed and has been rising all year and is now back in positive territory.

Source: Bloomberg
With their WLI clearly arguing against their recessionary call, the ECRI this year began to cite their coincident indicator to now justify it. An excerpt from the firm’s article in March is provided below:
Why Our Recession Call Stands (03/15/2012)
Many have questioned why, in the face of improving economic data, ECRI has maintained its recession call. The straight answer is that the objective economic indicators we monitor, including those we make public, give us no other choice.
Let’s start with the current state of the economy. A couple of weeks ago, we publicly highlighted ECRI’s U.S. Coincident Index (USCI). It’s important to understand that the USCI isn’t a random concoction of data, but rather the gold standard for measuring current economic growth, as it summarizes the key coincident economic indicators used to determine the official start and end dates of U.S. recessions; namely, the broad measures of output, employment, income and sales. So when USCI growth is in a downturn (bottom line in chart), it’s an authoritative indication that overall U.S. economic growth is actually worsening, not reviving…
The bigger question is can unprecedented, concerted global monetary policy action repeal the business cycle? The objective coincident and leading indexes that we have always monitored are still telling us that it cannot.

Source: ECRI
There are two issues I have with the comments ECRI made in the above article. The first is that the firm switched from using their growth formula for their WLI (see image above of the WLI and S&P 500) to a standard annual year-over-year (YOY) growth rate which painted a less rosy picture. They in essence used whatever growth rate made their recession call look better citing seasonal factors; Dwaine Van Vuuren from RecessionAlert in an article (ECRI WLI Growth Conundrum) stated that “even if the smoothed growth rate were to start falling, the 12-month growth rate will continue to rise as it “lags” the smoothed growth rate. This would in part seem to debunk ECRI’s statements that 12-month growth rates are foretelling a recession.
The other issue I have is the firm’s now focused use of their coincident index rather than their leading index. Like their switch to using a YOY calculation for their WLI instead of their traditionally used smoothed growth rate, the firm now focuses on their coincident index in an attempt to bolster their recession call. While the ECRI Coincident Index’s YOY growth rate was declining last month when the firm used it to support their recession call, it has recently stabilized and is no longer declining. Given the six month change in the Coincident Index is actually now rising for several months the YOY growth rate is likely to get a lift and thus remove another leg from the ECRI’s recessionary stool. The advantage of using the six month rate of change is that the 0% level serves as bookends to recessions unlike the YOY rate of change the ECRI uses which may still be in positive territory when the economy slips into a recession. At a reading of 1.6% the economy appears to be picking up steam once more and invalidating the ECRI’s recession call.

Source: Bloomberg
Our own recession probability model suggests no recessionary warning flags as the chance the U.S. is currently in a recession is a mere 2% and it usually takes readings north of 20% before a recession becomes likely.
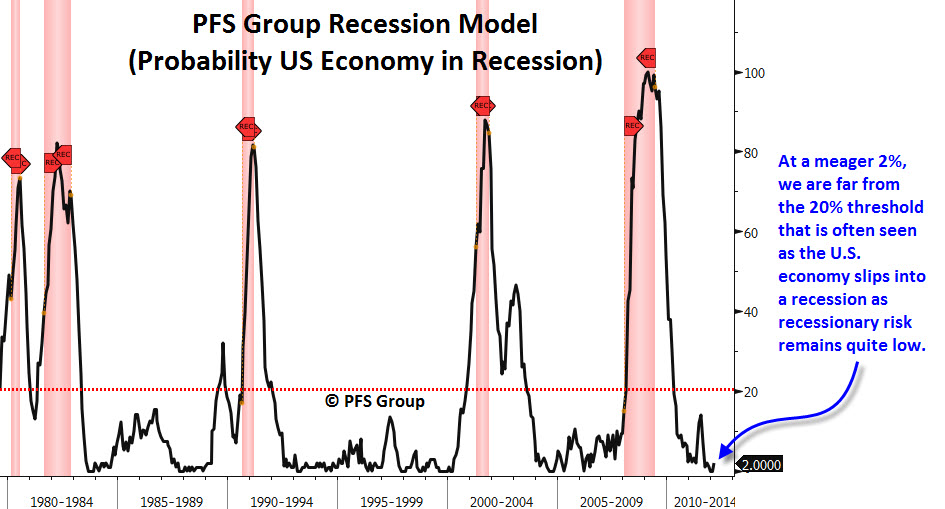
Source: Bloomberg
Another support for the economic bulls comes from the Philadelphia Fed’s State Coincident Index which measures coincident data for every state rather than just looking at the national level. The advantage of this is the ability to see how strong in terms of breadth and participation is the economic recovery. As of February, every single state in the nation showed a positive three-month rate of change. This is in stark contrast to the economic landscape seen during December 2007 which was the first month of the last recession. Back then only 34 out of 50 states showed positive economic growth. With 100% of the nation’s states showing positive economic growth, it will take some time for the nation’s economic momentum to slow before one could even consider the possibility of a recession occurring on the near horizon.

Source: Philadelphia Fed
Summary
Currently things are “All Quiet on the (U.S) Western Front”. Europe will have to be monitored closely to see if things heat up once more and the price action of European banks will likely provide us some clues. As long as things do not flare up again in Europe the strengthening U.S. economy will likely allow U.S. stock markets to rally further once the current intermediate correction ends. Looking at jobs data, a major component for U.S. economic activity shows we are likely to see continued payroll growth well into the second half of the year and other economic indicators are improving which goes against the ECRI’s recession call. A recession in the U.S. is simply not on the horizon though we will have many headwinds to face as we approach 2013 with massive tax hikes and the uncertainty of the November election. But until then, we likely have several months of favorable economic and stock market action ahead of us.


