


Typically there are a few major inflection points in the year where assets either switch gears and reverse their prior trends or undergo an acceleration of their current trend. One of the key themes that have often marked these inflection points over the last few years is the general trend of the USD. At present the USD is at yet another major inflection point and what it does from here will have direct implications for not only asset allocation (bonds, stocks, commodities, currencies) but also sector allocation (cyclicals, non-cyclicals).
Want to Know What to Invest In? Watch the USD
As mentioned in the opening, the general trend in the USD has far reaching investment implications, particularly for US investors. For example, when the USD is weak the following general relationships are seen:
“RISK ON” Trade
- Stocks outperform bonds
- Investment grade and high yield bonds outperform US Treasuries
- Foreign stocks outperform US equities
- Commodities are strong
- Commodity currencies outperform USD
- Cyclical sectors (Technology, Cons. Disc., Materials, Energy) outperform non-cyclical sectors (Cons. Staples, Utilities, Health Care)
When the dollar is strong you typically see the reverse of the above relationships. This general investment theme is shown below in which US stocks (S&P 500), commodities (CRB Index), and emerging market equities relative to the S&P 500 tend to have an inverse correlation with the dollar. The USD Index is shown below in green and inverted for directional similarity. Looking at the figure we can see that when the USD is rising (falling in chart) commodities and the S&P 500 are weak and emerging market equities underperform the S&P 500 (2008, early 2010), and the converse is also true (2009, late 2010-early 2011).

Source: Bloomberg
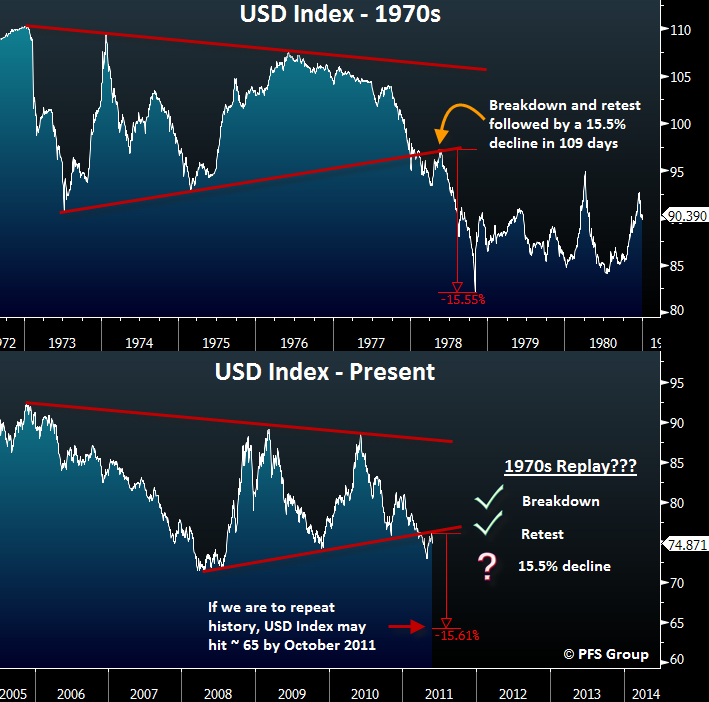
One of my big picture investment themes is the 1970s analog of the USD Index relative to the present. So far there has been a remarkable similarity of how the USD moved in the 1970s to the present, and so I believe it becomes quite valuable to bear that in mind in terms of portfolio management. To see what I am referring to, take a look at the figure below which shows the USD Index in the 1970s on the top panel and the USD Index presently on the bottom panel. You will notice in the 1970s that the USD Index had a big decline from early to mid 1973 before it staged a dramatic bounce heading into 1974. The second decline occurred from 1974 to 1975 followed by yet another bounce heading into 1976. The moves in the USD Index in the early seventies created a pennant formation which is formed by lower highs and higher lows. After peaking in 1976, the USD Index steadily declined until late 1977 in which it then accelerated its decline and broke the lower pennant support. In 1978 the USD Index rallied to test the underside of the broken trend line and then fell more than 15% in 109 trading days.
Source: Bloomberg
Looking at the bottom panel the USD Index looks to be eerily mimicking the 1970s general movements in which we saw two big down moves followed by sharp rallies and then a third decline that witnessed a break of the pennant lower trend line. Not only has the USD Index broken the lower pennant trend line as it did in 1977, it has now tested the underside of the lower trend line and what comes next, if past is prologue, is a 15% decline in the USD Index to roughly 65.
There is absolutely no guarantee that the 1970s analog will play out in the current case as the USD may have a false breakdown of the pennant and then rally back above into the pennant formation. However, the further the USD declines from present levels the more and more likely the bearish case for the USD is in play and the “RISK ON” trade has a green light. My personal leaning is that we do in fact continue to track the 1970s example.
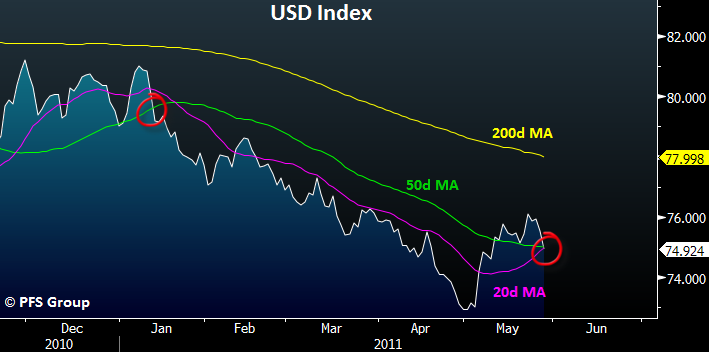
Since the early part of May the USD Index has been experiencing a short-term rally in which it looked like it was going to make a move to test its 200 day moving average similar to its rally in November-December of 2010. Once the USD Index broke its 50 day moving average (green line below) the bearish trend resumed. Presently the USD Index is testing its 50 day and 20 day moving averages and a decisive close below both would likely indicate the dollar is continuing its decline. Also, given the break in the multi-year pennant formation, the USD’s decline may accelerate to the downside.
Source: Bloomberg
What supports my belief in the bearish case for the dollar stems from its broad-based weakness to global currencies. Over the last month the USD has experienced a decent bounce but this strength is deceptive and not as strong as would appear on the surface. I track 30 world currencies and all four precious metals returns relative to the USD over various time frames to gain an understanding as to how weak/strong the USD is on a global basis, with my return table shown below.
The USD Index began to rally roughly one month ago and the third column from the left shows the 1-month returns relative to the dollar. You can see that only 6 out of 34 currencies and metals declined relative to the USD while 82% of them rallied, which indicates this countertrend bounce has been incredibly weak. A strong reversal in the dollar such as was seen in the summer of 2008 or late 2009 often occurs when it displays widespread strength. As shown in the table below, whether one looks at a one day relative return or a one year relative return, the USD Index is weak on a global basis and is not showing improving strength that would indicate a major reversal of its bearish trend.

Source: Bloomberg
If the dollar does experience a decline similar to 1978 (declineing over 15% in less than four months), one of THE primary beneficiaries would likely be commodities in general, and precious metals in particular. With gold already approaching 00/oz, some have a hard time imagining how much further it can advance. One way to analyze gold is on a relative basis to help create some price targets, and rather than purely analyze how high gold can rise, we also need to analyze how far the USD can fall as gold and the USD are two sides of a the same coin. Thus, looking at the value of US governmental holdings of gold bullion in relation to the US monetary base helps in determining some price targets for gold and to gauge how expensive it may be.
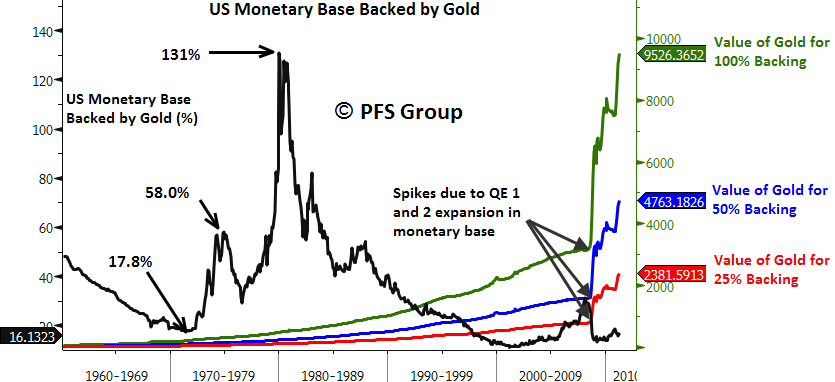
Shown below on the left hand side is the percentage of the US monetary base backed by the value of US governmental gold bullion (ounces of gold * current price). On the right hand side is the required price of gold necessary to back the US monetary base to a set percentage with 25%, 50%, and 100% backing shown. I’d like to make a few quick points. First off, please note that the beginning of the secular bull market in gold in the 1970s that took it from /oz in January 1970 to 5/oz ten years later (+2285%) began with gold representing a mere 17.8% of the US monetary base. By the middle of the decade after the first big run in gold US government bullion holdings represented 58% of the monetary base, and by the peak in early 1980 the value of governmental gold bullion represented 131% of the US monetary base. By the time the secular bull market in gold was over, the value of US gold bullion represented more than the entire monetary base!
While it may come as a huge surprise that after rallying from 4/oz in 2001 to a recent high of 77 (+520%), the present value of governmental holdings of gold bullion backing the US monetary base is currently BELOW the starting point of the prior secular bull run in gold! I believe this point is too big not to reiterate, the present value of gold bullion relative to the US monetary base is BELOW where it stood at the beginning of the last secular bull market.
 Source: Bloomberg
A large part of this is due to rapid expansion in the monetary base caused by quantitative easing (QE) round one and two by the Bernanke Fed which has more than doubled the monetary base in short order. To bring the gold backing of the monetary base to 25% would require a gold price of 82/oz, and for 50% gold backing would require a price of 63/oz, which would still be less than the peak seen at the mid point for the last secular bull market in gold in which by mid 1970s government gold holdings represented 58% of the monetary base. For 100% gold backing of the monetary base we would need to see gold rally to nearly ,000/oz.
As you can see, it is highly erroneous for anyone to call gold a bubble as we do not have an over abundance of gold bullion as we did of technology companies in 2000 or a glut of homes in 2005-2006. What we do have is a glut of US dollars. Shown below is the growth in the monetary base and global gold production. Since 1990 the monetary base has grown by 570% thanks to the Federal Reserve, while global gold production has grown by a mere 21%. So I ask you, where is the supply glut characteristic of a bubble, in US dollars or gold bullion?

Summary
Over the course of the last few years major pivot points in global financial market relationships have been centered around moves in the USD. I believe we are at yet another major inflection point and what the USD does from here will likely have widespread implications. If the USD Index tracks the path of the 1970s and witnesses a sharp decline in the months and years ahead, it is likely that the “RISK ON” trade will come back with a vengeance in which the S&P 500 vastly outperforms government bonds, higher yielding fixed income securities like investment grade and high yield corporate bonds will outperform US Treasuries, emerging markets will outperform the S&P 500, commodities will rally as will commodity currencies relative to the USD, and cyclical sectors will outperform non-cyclical sectors. For a sign that the “RISK ON” trade is actually “on,” I would look for a decisive close of the USD Index below its 50 day moving average. However, if the USD instead stages a strong rally back above its prior broken trends then the converse of the “RISK ON” trade will likely be the order of the day. That said, my personal leaning is towards a USD decline given the widespread weakness relative to global currencies and precious metals. If the USD does experience an accelerated decline in the months ahead, then precious metals are likely to be the ultimate beneficiary.


