


The markets were down big this week, with much of the profit-taking in high growth stocks and popular momentum names. Given our warnings over the past two months (see archive), readers should not be alarmed with this current downturn given that many of the signals were present in terms of waning market breadth and momentum.
The number one question at this point is how much further do we go?
Most of the indicators we follow show that there's still more downside room to go until we've reached oversold levels. With that said, there was some heavy selling and signs of capitulation by investors out of the NASDAQ 100 (QQQ)—similar to only one other time over the past decade—and so the downside may be more limited in tech-related names. Also, as we've been pointing out for quite some time now, the long-term trend and momentum of the market still remain in bullish territory (and have actually improved during the correction!), which is why we believe this should be viewed as a healthy pullback in an ongoing bull market.
Market’s Weekly Bill of Health
S&P 1500 Member Trend Strength
As shown below, the long-term outlook for the S&P 1500 actually improved from last week and is clearly bullish as 81.8% of the 1500 stocks in the index have bullish long-term trends. The market's intermediate-term outlook also improved and is now bullish at 64.4%. As expected, the greatest deterioration has been seen in the short-term moving averages, which are now bearish.

* Note: Numbers reflect the percentage of members with rising moving averages: 200-day moving average (or 200d MA) is used for long-term outlook, 50d MA is used for intermediate outlook, and 20d MA is used for short-term outlook.
The most important section of the table below is the 200d SMA column, which sheds light on the market’s long-term health. As seen in the far right columns, you have 82% of stocks in the S&P 1500 with rising 200d SMAs and 60% of stocks above their 200d SMA. Also, all ten sectors are in long-term bullish territory with more than 60% of their members having rising 200d SMAs. Importantly, former market leaders are now oversold when looking at the percent of stocks above 20 and 50-day moving averages, which indicates we are nearing a bottom.

Source: Bloomberg
S&P 500 Market Momentum
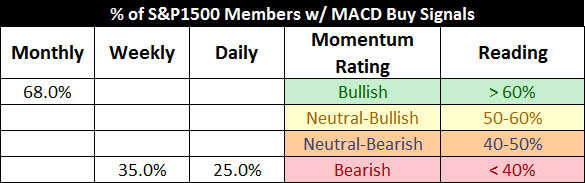
The Moving Average Convergence/Divergence (MACD) technical indicator is used to gauge the S&P 1500’s momentum on a daily, weekly, and monthly basis. As noted in our last Market's Bill of Health on April 4th (see here), we were concerned that the market's breakout to new highs didn't lead to a weekly buy signal, which indicated more consolidation/weakness ahead.

Source: Bloomberg
Digging into the details for the 1500 stocks within the S&P 1500 we can see that the daily momentum for the market has fallen into bearish levels and is now at 25%
The intermediate momentum of the market also weakened by falling to 35% from 45% last week.
The market’s long-term momentum remains bullish at 68%, though it has fallen from 72% as of last week. The best way to read the table below is that we are deeply oversold on an intermediate (weekly) and short-term (daily) basis in an ongoing bull market as the monthly readings remain in bullish territory.
Source: Bloomberg
You can see the weakening momentum of the market below where the monthly MACD buy readings (green line) peaked in the fall of 2013 while the market began to make higher highs. The take away from all of this is that the foundations of the market have deteriorated with the loss in momentum, though the long-term trend and momentum still remain in bullish territory.

Source: Bloomberg
Below is a multi-indicator chart of breadth and momentum in the S&P 500, which shows we are slightly below neutral readings on most of intermediate-term indicators and suggests this market can still go lower.

Source: Bloomberg
As mentioned in the very beginning, we did see some very heavy selling and signs of capitulation by investors out of the NASDAQ 100 (QQQ)—similar to only one other time over the past decade (see chart below)—and so the downside may be more limited in the large-tech space. We saw similar behavior in the S&P 500 ETF (SPY) (see story), which marked the short-term bottom seen in February.
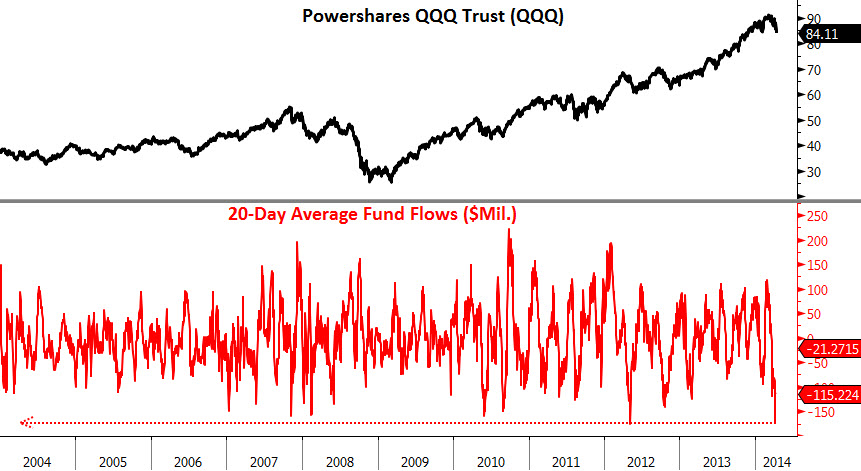
SourceSource: Bloomberg
Summary
While the S&P 500 and the Dow Jones Industrial Average are not that far off from their highs, there is greater deterioration beneath the surface which becomes readily noticeable when viewing the small cap Russell 2000 Index or the tech-heavy NASDAQ Index. The weakness we were seeing in momentum and breadth that was highlighted last month with words of caution has now come to fruition. The question now is whether the selling is over and whether or not the market has put in a top. As highlighted in the previous section, most of our indicators are just below neutral and have more to go before hitting levels associated with intermediate lows, but we are likely nearing the end of this correction as evidenced by massive flows out of the NASDAQ 100 (QQQ), similar to what was seen with fund flows out of the S&P 500 ETF (SPY) back in February. The long-term trend and momentum of the market remain in bullish territory and so this pullback should still be viewed as a correction in an ongoing bull market until proven otherwise.


