


Summary
- Economic momentum is building
- Market internals are stronger than headline indexes portray
- Decade high percentage of "neutral" investors likely to capitulate to bull camp
- Investor trepidation about putting capital back to work should take solace by signals from the “smart money” crowd
Signs of a market bottom have been building over the last week with today serving as no exception. Today, we received the Markit Economics flash composite purchasing managers’ index for May, which hit a 4-year high of 58.6, up from 55.6 in April and up from last May’s 54.5 reading. The 58.6 reading marked the seventh consecutive month of expansion (readings north of 50) and saw the new orders index rise to the highest reading since February 2011.
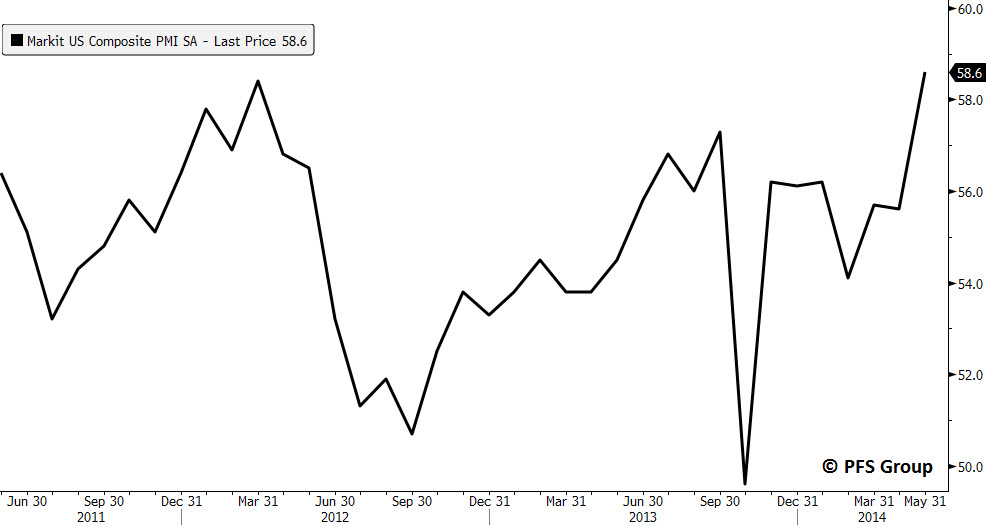
Source: Bloomberg
The Markit Composite PMI release for May builds on a string of positive economic surprises which has helped push the Citigroup Economic Surprise Index into positive territory for the first time since February after bottoming in early April.

Source: Bloomberg
The economic momentum is beginning to spill over into market momentum as both the beaten up NASDAQ and Russell 2000 indexes regain their footing. For signs of an intermediate-term bottom I look for the percent of members within an index with a MACD baseline north of zero to reach 30% or less (middle panel below). Once this occurs, I then look for a surge in momentum as evidenced by a spike in MACD buy signals over a 10-day period for the components of an index (bottom panel below). Presently, we’ve seen 28.86% of the more than 2500 members in the NASDAQ generate a MACD buy signal over the last 10 days, which is the strongest surge in momentum since the November 2012 bottom. Not only is the surge in momentum an encouraging sign but so too is the ability of the NASDAQ to recapture its 50-day moving average.

Source: Bloomberg
Along with the tech-heavy NASDAQ, the small-cap Russell 2000 Index is also showing signs of emerging from an intermediate-term bottom as it has seen MACD buy signals on nearly 30% of its 2000 members over the last 10-days and is on the verge of regaining its 50-day moving average as well.
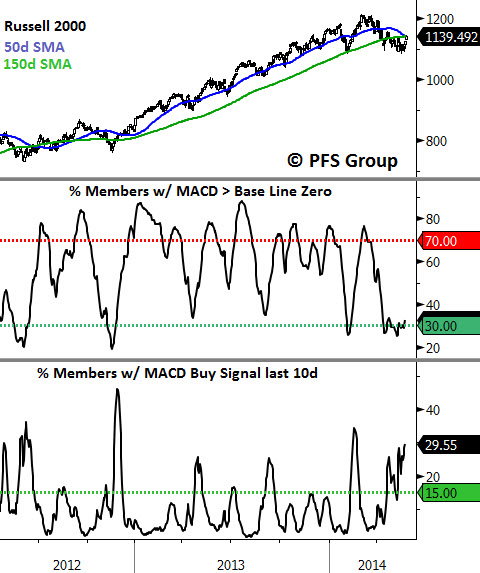
Source: Bloomberg
While the NASDAQ and the Russell 2000 indexes are still well off their highs, other indexes like the S&P 500 are hitting all-time highs and the recent move is drawing many skeptics. Many bears are calling the breakout in the S&P 500 as a head fake and cite the lack of volume supporting the move higher, but a look at internal data would suggest otherwise. For example, the cumulative advance-decline line for the S&P 500 (blue line below) hit a new high to confirm the move higher, which implies there are more stocks rallying than declining. In terms of a lack of volume, while overall volume is low, what matters most is that up-volume is greater than down-volume and the net balance as measured by the on balance volume indicator (OBV, red line below) suggests there is clearly more buying than selling as the bulls outnumber the bears. Given the internals shown below, the bulls' grip on the market continues to strengthen.
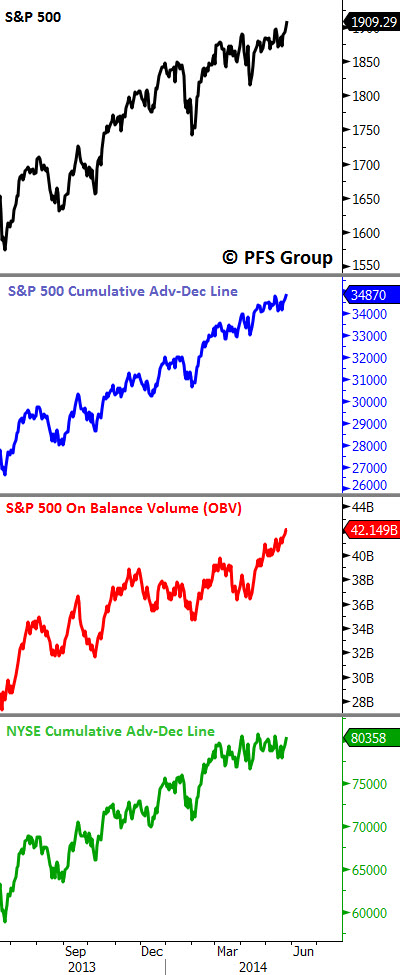
Source: Bloomberg
Many individual investors are scratching their heads and unsure what to make of this market, which appears ready to roll over into a nasty correction just as much as it looks to hit new highs. Anyone confused on the market’s direction should know they are not alone as the American Association of Individual Investors (AAII) neutral reading hit a decade high last week at 43% as nearly half of those polled are sitting on the fence. With continued improvements in the market and more positive economic releases, the bulls are likely to convert more of the record pool of investors sitting on the fences to their camp.

Source: Bloomberg
The spread between the percentage of bulls less bears from the AAII survey is positively correlated to the Citigroup Economic Surprise Index and if we continue to see incoming economic releases surprise consensus expectations to the upside then we are likely to see the large pulls of investors move to the bullish camp and push this market higher as they reengage the markets with their capital.

Source: Bloomberg
What should help give those neutral on the market a push toward the bullish camp is a further alignment with investors in the credit markets, which I consider the “smart money” since the credit markets usually peak well before the stock market does. Shown below is the Bloomberg US Financial Conditions Index, a composite of many credit spreads, which recently hit a cycle high, confirming the S&P 500’s move to new highs as well.

Source: Bloomberg
Summary
Most of 2014 has been characterized by a directionless market, but recent improvements in economic and market momentum indicate the scales may be tipping more decisively in favor of the bulls. The recent highs in the market are being received with a hefty dose of skepticism, but looking beneath the market’s hood suggests internals are strong and confirming the market’s move to higher levels. With continued improvements in the market and more positive economic releases, the bulls are likely to convert a greater share of the record pool of investors remaining neutral into their camp. Any neutral investor who does so should take solace in knowing they are joining the ranks of the “smart money” as credit markets confirm the recent move higher.


