


With markets digesting the onset of global QE, various areas of the market have taken a breather while some have weakened more than others (i.e. technology). The end result is that, while still bullish with a reading over 60%, the S&P 500’s long term trend has deteriorated from a month ago when 75.2% of its 500 members were in long term bullish trends to its current reading of 66.6%. Markets do not move in straight lines and it is likely that we've been merely going through a consolidation over this past month. However, an indication that the recent weakness is something more will become evident if we see the long term and intermediate outlooks deteriorate to sub 60% readings to a neutral-bullish reading.
S&P 500 Trend Strength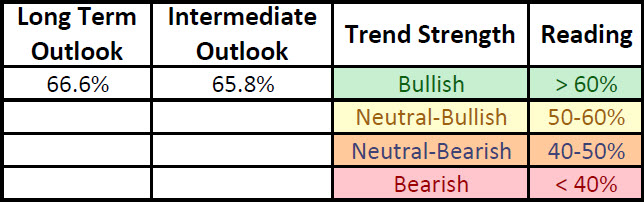
* Note: For further explanation of the market surveys and background on analysis, please click here.
200 Day Moving Average Evaluation – Long Term Trend Determination
As shown in the table below, the net percentage of stocks that are in long term uptrends decreased to 67% while the percentage of stocks in downtrends increased to 33%.In terms of sectors, the telecom sector lost the top spot to the financial sector which saw the percentage of its members in uptrends increase to 80%. The absolute worst sector is technology as only 47% of its members are above their 200 day moving averages.

Moving Average Trend Analysis (MATA) – Intermediate Term Trend Determination
The MATA survey for the S&P 500 has been more or less flat near 66% over the last four weeks with some amount of sector rotation. For example, a month ago 76% of the technology sector had bullish intermediate trends while that has declined to 49% currently while materials have improved sharply from their month ago reading of 58% in bullish intermediate trends to the current 74%. Health care was another bullish standout over the past month as the percentage of its members in bullish intermediate trends jumped from 60% to 81%.

52-Week Highs and Lows Data
The data for the S&P 500 for 52-week highs and lows shows broad-based strength with both cyclical and non-cyclical sectors participating. A month ago 21% of the 500 stocks within the S&P 500 made a 52-week high over the prior four weeks; that has since improved to 35% currently. Reflecting the intermediate term strength trends in the MATA survey, the health care sector has seen half of its members hit 52-week highs over the last month while a month ago the reading stood at 21%. Overall, looking at the S&P 500 shows 35% of its members hit 52-week highs over the last month while only 2% hit new 52-week lows, which is a very bullish breadth figure and not indicative of an impending top anytime soon.

Source: Bloomberg
Sector & Asset Class Rotation
Below is the relative rotation graph from Bloomberg that shows both the relative momentum and relative performance of assets versus a benchmark. Numbers north of 100 show improving relative momentum while numbers below show weakening relative momentum to the benchmark, and numbers to the right of 100 show outperforming assets and to the left underperforming assets.
Market Cap Rotation
Over the last quarter we have seen a continued rotation from mega cap issues (S&P 100, OEX) and into smallcap (S&P 600, SML) and midcap issues (S&P 400, MID) which reflects the markets growing risk appetite. The real improvement over the past few weeks has been seen in the midcap space as its relative momentum (vertical movements in rotation chart below) has seen the biggest jump.
Weekly Market Cap Relative Performance to S&P 500
Source: Bloomberg
Sector Rotation
The big standouts in terms of sector rotation over the last month has been the continuing strength in financials while energy has given back some of its bullish momentum as has the telecom sector. The consumer discretionary sector has also been gaining some bullish momentum due in part to the improvement seen in the homebuilders and housing-related segments.
Weekly Sector Relative Performance to S&P 500
Source: Bloomberg
Fixed Income Rotation
Just as there is a clear rotation to risk assets in market cap performance and sector relative performance, we are seeing the riskier classes within fixed income outperform US Treasuries as high-yield, corporate bonds, preferreds, municipals, and emerging market bond funds are all gaining ground on US Treasuries as investors' appetite for risk grows even in the fixed income sector. Over the last quarter the emerging bond market (EMB) is now outperforming the UST market (TLT), with investment grade corporates (LQD), high yield (HYG), and preferreds (PFF) also moving close to outperforming UST’s on a trailing quarterly basis.
Weekly Fixed Income Relative Performance to iShares Barclays 20+ Year T-Bond
Source: Bloomberg
Summary
The market’s long-term and intermediate-term trend remain in bullish territory though the strength in the S&P 500’s long term trend has moderated over the past month. The S&P 500’s intermediate trend remains flat as sectors that have weakened over the past month (technology, energy, telecom) have seen their weakness made up by the strength in other sectors (financials, consumer discretionary, materials). Given the strength in breadth readings heading into the recent market peak, it is likely we are simply digesting the gains off the June lows. For a sign of an impending top we would want to see a higher high in the markets coupled with weakened breadth as bullish participation wanes. As of yet we have not seen that development, which indicates a higher probability of further gains.


