


There is a fairly regular pattern to how the market behaves during what is called the "four-year election cycle." Typically, we get a peak in the spring, a bottom in late summer, and then a strong rally into the pre-election year:

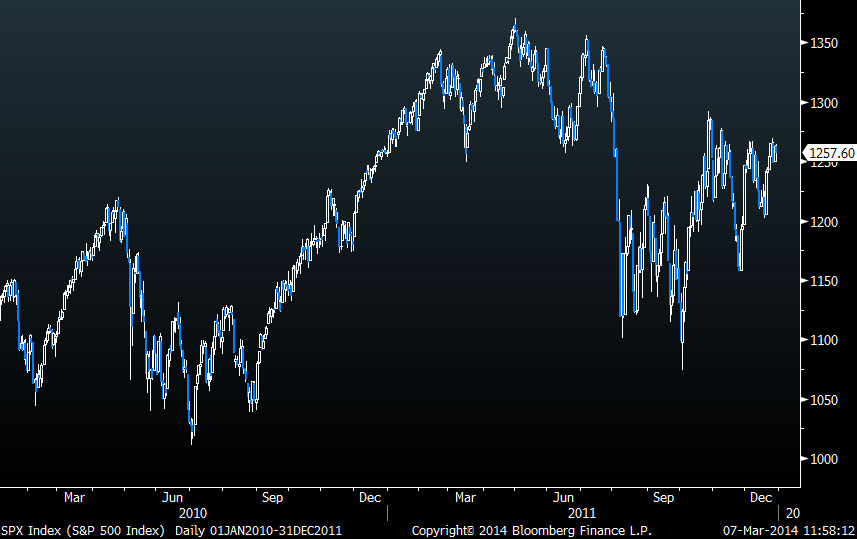
We more or less had that pattern in 2010-2011, where we peaked in the spring, bottomed in the summer, and then rallied into the middle of the pre-election year (2011):
The chart below is an average of the last 5 mid-term election years, excluding 2002 (I'm not anticipating a bear market this year), overlaid by the S&P 500 so far this year. The pattern suggests a rally of 6.5% into an April peak before giving back all of its gains, followed by a bottom in late August, to finish up with a strong year-end rally.

For reasons why I don't expect a major market peak or bear market this year, please see the following:


