


Far too often investment managers and economists spend more time espousing their views and then defending them until eventually proven right (“I was just early”), rather than spending more time analyzing their assumptions and being honest enough to say, “I WAS WRONG!” and then moving forward. Part of the problem is that they create a view and then find evidence to support their views rather than starting from the bottom up by collecting an exhaustive amount of data and then summarizing the collective message rather than their views. Basically, listen to the message of the markets and then interpret those messages rather than telling the markets what they should be doing. What the market IS doing is far more important than what you think the market SHOULD be doing. Right now the message of the stock markets, credit markets, and economy is this, “THERE IS NO NEAR-TERM RECESSION OR BEAR MARKET COMING!”
Change on the Margin
Are things improving (bullish) or weakening (bearish)? What is more important than the absolute level of something is the change in direction. This is vital for both the economy and the stock market and watching for subtle changes can provide early clues to help identify major turning points. A bull market top isn’t formed in a day nor does an economy stop expanding all at once, it’s a process and watching for changes in terms of breadth is vital.
Think of the change in the seasons, we know we are moving from summer to fall when we see the leaves change color. Think of this transition as the momentum of the stock market and economy beginning to slow but is still advancing/growing. We know winter is approaching when we see individual leaves fall from the trees. The same is true for the stock market where one by one individual stocks enter their own private bear markets until finally the change is noted in the various major indices. Same goes for the economy: one by one states fall into recessions where at some point there are enough states in recession to bring the national GDP level into recession. We know spring is approaching when we suddenly see leaves budding on trees. This is akin to individual stocks that stop declining and begin advancing or states that stop showing contracting economic output. (See diagram below).

Message from the Economy: NO RECESSION
Continuing with the “change on the margin theme,” when you look at the Philadelphia Fed’s State Leading Index for all 50 states below, what season does the leading economic indicators for the nation say we are entering? Do you see a blanket of orange or red states below? No. Then clearly we are not at risk of moving into a recession any time soon as the economic map below shows a transition from spring to summer (light green to dark green).
Philadelphia Fed State Leading Index

Additionally, when looking at the ISM Manufacturing or Non-Manufacturing reports for the country, both are above 50 (expansion) and both are rising. You can view the ISM reports also like the seasons. When they are above 50 and rising you are in “summer” and when they are above 50 and falling you are in “fall” and when they are below 50 and falling you are in “winter” and below 50 but rising you are in “spring.” So looking at the manufacturing and non-manufacturing components of the economy we are entering summer as the ISM indexes are leading economic indicators, both rising and expanding (above 50). The ISM message also corroborates the Philly Fed data above.
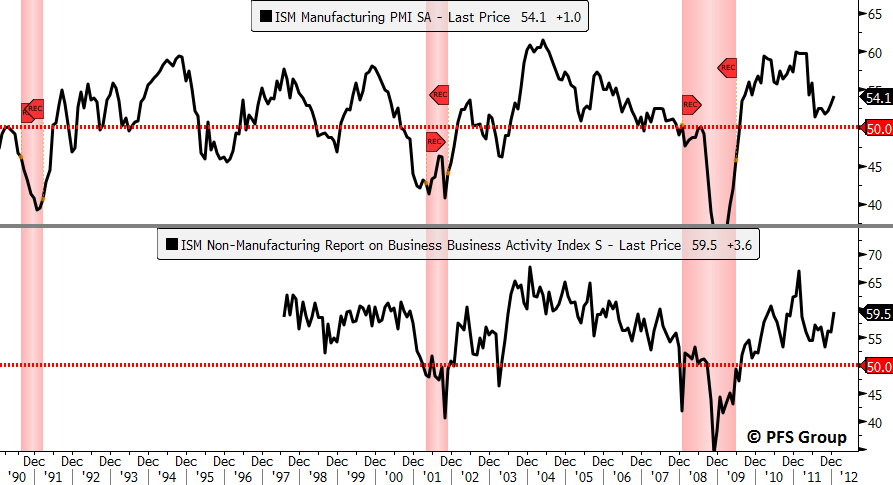
Source: Bloomberg
Beside overall economic output as measured by the two economic surveys above, we are also seeing major improvements on the credit side as seen by the Federal Reserve’s Senior Loan Survey for January. Increasing credit demand leads to increased spending which leads to increased economic activity. Right now we are seeing net demand for commercial and industrial loans back in positive territory, demand for consumer loans at the highest level in seven years, and demand for commercial real estate loans near at a 14-year high. What was also impressive in the report was that demand increased DESPITE banks raising lending standards as more qualified borrowers are getting loans. Clearly these are not the developments of an economy nearing a recession but rather shows economic activity is set to increase in the months ahead.
Federal Reserve Senior Loan Survey


Message from the Stock Markets: NO BEAR MARKET
Again, continuing with the “change on the margin” theme, when you have more than 80% of the stock market in confirmed uptrends it is a safe bet to assume you are in a bull market and either in spring or summer in terms of the seasons. One way to measure an uptrend is the relationship between short (1-month), medium (3-month) and long-term (6-month) moving averages. I determine the trend for all 500 stocks within the S&P 500 and broke them out by sectors and 81% of the 500 stocks within the S&P are in uptrends. That is the very definition of broad-based bullish participation and not what you see in a market about to top any time soon. Below is a diagram of the moving average cycle evaluation I used for the S&P 500 and the definition of various uptrends and downtrends. I define uptrends as U2 (confirmed uptrend) and U3 (well-defined uptrend) and downtrends as D2 (confirmed downtrend) and D3 (well-defined downtrend).

As seen above, 81% of the 500 stocks in the S&P 500 are in uptrends (U2 & U3) while 9% are in confirmed downtrends (D2 & D3). Another key takeaway is that the most cyclical components of the market are the very sectors with the strongest market breadth. For example, financials are leading with 95% confirmed uptrends followed by Industrials with 93% confirmed uptrends and Materials with 90%. Cyclical sectors outperform during economic expansion and underperform during economic contractions and their clear leadership highlights that we are in a strong bull market and nowhere near peaking.
In terms of looking for the transition from summer to fall to winter to spring I will look for where in the table above the most stocks within a sector are located. A move from summer to fall would see more stocks moving into the D1 category (possible downtrend) and a progression towards winter (bear market) would see more stocks moving into the D2 (confirmed downtrend) and D3 (well-defined downtrend) categories.
Another market breadth technique that confirms the moving average cycle analysis above is the evaluation of the 500 stocks within the S&P 500 relative to their 200 day simple moving average (200d SMA). Stocks that are Above a Falling 200d SMA (AF) are breaking out of bases and moving into individual bull markets (~ spring). Stocks Above a Rising 200d SMA (AR) are in confirmed bull markets (~ summer). Stocks Below a Rising 200d SMA (BR) are moving into bear markets (~ fall) while stocks Below a Falling 200d SMA (BF) are in confirmed bear markets (~ winter). As seen below, we have 76% of the 500 stocks within the S&P 500 that are in uptrends where 43% are moving out of bases (AR) and 33% are in bull markets (AF).

Like the moving average cycle evaluation above, across all ten sectors for the S&P 500 you have more stocks within uptrends than downtrends indicating broad bullish participation, not what you would see in a market that is topping (BR category) or in a bear market (BF category).
Message from the Credit Markets: Financial Stress Easing
The last four years have been a roller coaster of stock market and economic fluctuations with associated swings in financial stress. During periods where economic activity weakens and stock markets roll over we see credit spreads rise as financial stress increases. Conversely, when the economic and stock market climate improves we see credit spreads come down just as we did late in 2008 and mid 2010. We are seeing once again credit spreads across the board decline as fears of a European contagion are easing. As seen in the figure below, credit spreads both here in the U.S. (top panel) and in Europe (bottom panel) are coming down from elevated levels indicating stress within global financial systems is abating.
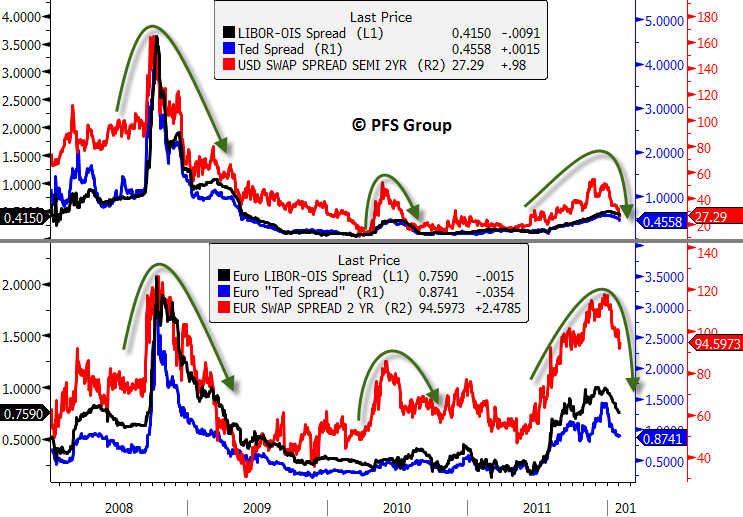
Source: Bloomberg
Overnight lending rates between banks are also finally plummeting as banks are more willing to lend to each other.
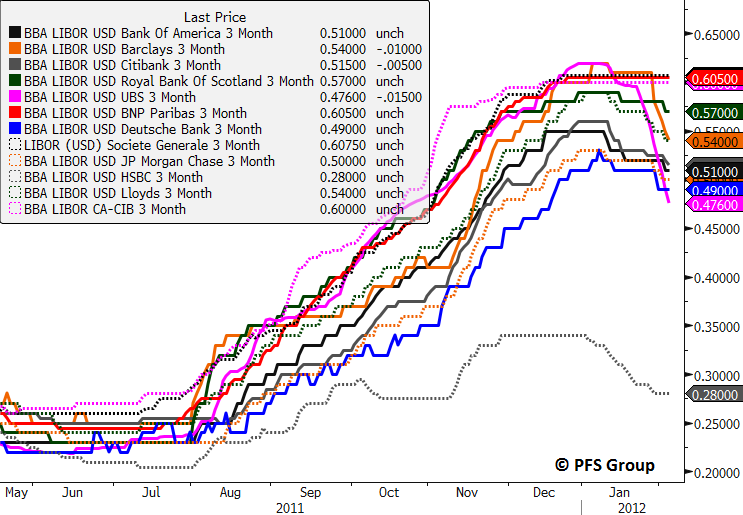
Source: Bloomberg
European bank stocks are also confirming easing fears over credit contagion. Large, mid, and small cap banks within Europe have rallied strongly off their 2009 lows. We have seen false rally attempts in 2010 and 2011 and we will have to see how strong the improvement in Europe is based on the strength in the banking stocks. If the banks continue to rally (as they did in 2009) then European debt fears are on hold while any weakness within the banks with moves back below their 150 day moving averages (2010 & 2011) would indicate European credit fears are flaring up again.

Source: Bloomberg
Conclusion
We are presently in the third bullish market advance and economic expansion since 2009 as the stock market, economy, and credit markets are all in bullish harmony; not to mention central banks (“Central Banks to the Rescue Revisited”). From my vantage point, it makes more sense to be bullish rather than fight the collective power of an improving stock market, economy, credit market, and expansionary central banks. You can yell and scream at the markets and economies of the world all you want, but they have a voice too and their collective message of the data is telling anyone listening the following messages:
- The US is not about to enter a recession
- The US stock market is not about to enter a bear market
- Global stock markets are improving
- Financial stress is easing
- The risk of European credit contagion is easing
- European banks are not imploding
In the famous words of Chauncey Gardner: "There will be growth in the spring".


