


Bill Gross of Pimco made major news last month when it was learned that they—the world’s largest bond manager—were shorting US debt in its flagship Total Return Fund. Of course, it’s not hard to understand why they'd be shorting U.S. Treasuries—one merely has to look at the government’s indebtedness and lack of political willpower to reach such an obvious investment conclusion. However, it is likely Gross will be early on his call as the possible exceptions he provides for why US debt may rally appear to be gaining steam.
Leading Economic Indicators Signaling Growth Relapse
Reuters interviewed Gross last Friday and when asked what would change his mind in regards to government debt he said the following (emphasis added):
Treasury yields are currently yielding substantially less than historical averages when compared with inflation. Perhaps the only justification for a further rally would be weak economic growth or a future recession that substantially lowered inflation and inflationary expectations.
This is beginning to happen as the decline in commodities prices as seen by the fall in the Reuters CRB Commodity Index has gone hand-in-hand with a decline in US 5-Year breakeven inflation rates. Rather than being a temporary phenomena, the weakness in commodities and decline in breakeven inflation rates may persist as leading economic indicators are rolling over.

Source: Bloomberg
One very useful investment tool is the Economic Cycle Research Institutes (ECRI) Weekly Leading Index (WLI). The WLI will often give an early warning about economic growth well in advance of the economy and even before the stock market at times (see red and black arrows below). For example, the WLI peaked late in 2003 after the initial improvement in the stock market and economy and subsequently rolled over heading into 2004 to suggest a growth scare which led to a decent pullback in the S&P 500. We had another smaller growth scare in 2006 in which the WLI declined and briefly went negative which was followed by an eventual sell off in the markets before the S&P 500 bottomed in the summer. In the middle of 2007 the WLI peaked once more and decelerated to signal yet another growth scare well ahead of the stock market peaking in the fall. However, unlike 2006 the WLI did not turn around but continued to plunge as the economy transitioned from a growth scare to a recession. Yet again the sizable decline in the WLI from the late 2009 peak preceded the 2010 summer correction, and it appears that the WLI is once more in a topping phase that will likely foreshadow a growth scare going into this summer.

Source: Bloomberg
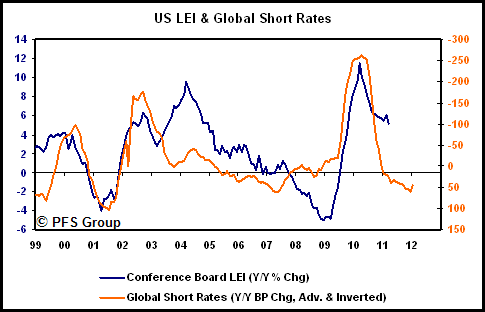
While the ECRI’s WLI is a great leading economic indicator, there are other indicators that often provide even greater advance warning and are what I would call long leading economic indicators. Perhaps chief among them is the monetary policies of the world’s central bankers. It is certainly true that money makes the world go round as nothing moves an economy or the stock market like easing monetary and fiscal policy, though with a lag. The large interest rate cuts in 2008 helped pave the way for the improvement seen in 2009 and conversely, the interest rate hikes of world central banks that began late in 2009 are helping to cool global growth currently. This can be seen in the chart below which shows the average change in basis points of world central bank interest rates (orange line) which is shown advanced and inverted for directional similarity alongside the Conference Board’s Leading Economic Indicator (LEI). The rate raising cycle of central banks is likely to continue to cool global growth abroad and here in the U.S. (lower U.S. exports) throughout much of the rest of the year.
Source: Bloomberg
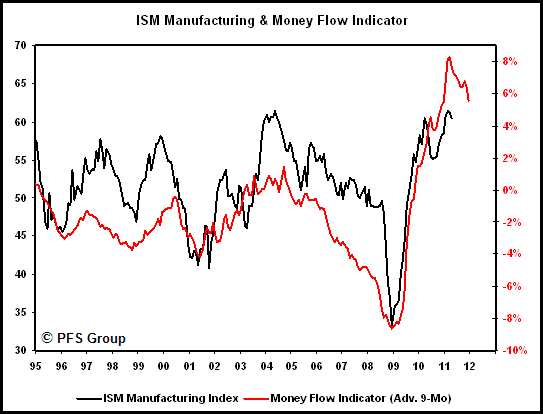
Another useful tool seen below is a money flow indicator that tracks the velocity of money within the economy, which typically leads the Institute for Supply Management’s (ISM) Manufacturing Index by 6-9 months. Like the Global Short Rate indicator above, the Monetary Flow Indicator is signaling weaker manufacturing readings throughout the summer.
Source: Bloomberg
One final long leading economic indicator that supports the Global Short Rates and Money Flow indicators is the relative performance of early to late-stage cyclicals. Starting with the onset of quantitative easing 2.0 last year, late-stage cyclicals like energy and basic materials have been outperforming early cyclicals like financials and consumer discretionary. The relative moves between early and late-stage cyclicals is often a great early warning in terms of what the ISM numbers will be more than six months out, and recent relative underperformance by the early cyclicals is hinting of an ISM reading south of expansionary territory which is sub 50 numbers as we head into the end of the year.

Source: Bloomberg
Investment Implications
With the long leading economic indicators heralding a growth slow down into the end of the year, and current leading economic indicators like the ISM Indexes already peaking, investors will want to shy away from risk assets and move into defensive assets. As highlighted below, falling readings for the ISM Indexes do not paint a bullish picture for the stock market as the year-over-year change in the S&P 500 is highly correlated to the trends in the ISM Indexes. If the ISM numbers fall below 50 that would target negative year-over-year returns for the market and why investors should probably think more about the return OF their capital than the return ON their capital.

Source: Standard & Poor’s, ISM
While the stock market shows a negative correlation with the ISM Indexes, bonds show a positive correlation and may outperform the stock market for several months. Illustrating the relationship between bonds and the ISM Indexes is shown in the figure below where you can see the year-over-year change in 10-yr US Treasury yields moves in sync with the ISM readings. A decline in the ISM readings going into summer would likely lead to a decline in interest rates and a rise in bond prices.

Source: Bloomberg
When looking at various asset classes, it does appear like we are seeing the switch from the risk-on trade (stocks and commodities) to the risk-off trade (bonds, cash/USD). Below is the performance of assets since April 9th of last year and commodities (CRB Index) appear to be topping while bonds and the USD are rallying. The S&P 500 remains strong and may yet advance further before running into weakness bit I wouldn’t ignore the price action in commodities as the CRB Index peaked in January 2010 well before the S&P 500 peaked in April of last year before the summer correction.

Source: StockCharts.com
Despite the S&P 500 putting in a recent 52-week high (which would be a sign of strength), the relative performance of sectors is showing a transition from the risk-on trade to the risk-off trade as non-cyclical sectors are becoming market leaders while economically sensitive sectors are becoming laggards. Below is the relative rotation graph from Bloomberg that shows both the relative momentum and relative performance of sectors versus the S&P 500. Numbers north of 100 show improving relative momentum while numbers below show weakening relative momentum to the S&P 500, and numbers to the right of 100 show outperforming sectors and to the left underperforming sectors.
Over the last few weeks we can see the utilities, consumer staples, telecommunications, and health care sectors showing the best relative momentum (north of 100) and moving to become market leaders with the health care sector already outperforming now on an intermediate basis (now in box 2). Cyclical sectors like information technology and financials are both underperforming the broad market and showing weakening relative momentum (box 4). On an intermediate basis the industrials and energy sectors are still outperforming the S&P 500 (to the right of 100, boxes 2 and 3) but are showing weakening relative momentum as they are below 100 (boxes 3 and 4). The technology sector and financials are considered early cyclicals and the energy and industrial sectors are considered mid and late-stage cyclicals. These sectors are living up to their names as the technology and financials worsened first followed by the industrials and energy. Conversely, non-cyclical defensive sectors are moving to become market leaders.

Source: Bloomberg
The figure above highlights the shift out of risky cyclical sectors and into defensive non-cyclical sectors. After the past week’s beating in commodities a bounce is likely given their oversold condition, though while some may be tempted in buying the dips of risk assets the leading economic indicators suggest otherwise as weakening economic growth may persist for much of the remainder of the year. Thus, rather than using market weakness to buy risk assets, investors may be wise to do the opposite and use market strength to reduce their risk asset exposure and buy defensive sectors.
US Government debt is perhaps the worst possible long-term investment and Bill Gross is likely to be proven right in the long run; however, like the summer of 2010 in which stocks and commodities sold off and bonds and the USD rallied, bonds may yet hold off the bears if we have another growth scare. Interestingly enough, a growth scare that may create temporary buyers of US debt could not have come at a better time as the Fed is slated to end their buying program for US Treasuries next month. If we do have material weakness in the economy ahead and stocks and commodities sell off, that might be all the justification Bernanke needs to launch yet another round of quantitative easing. Given the volatility seen over the last three years, we’ve been shown that next to anything can happen and investors need to remain flexible. While a defensive posture may be the optimal strategy for the here and now, constant monitoring of the markets, government, and monetary officials is a must as trends can change on a dime.


