


Last month the Danielcode was recognised as one of the most original market works of a generation by being named as an official Partner/Educator by Genesis Financial Technologies, whose charting program and data I use exclusively. Go to their web page at www.genesisft.com , click the “Partners” link and then “Educators”. You will see that the Danielcode has been recognised with the famous names and giants of the trading business. Few achieve this recognition. Especially few who live in far away lands, don’t advertise or make personal appearances at expos. In fact the Danielcode is practically unknown outside the pages of Financial Sense.
The growth and recognition of the Danielcode is due to the generosity of the Puplava family who have allowed me to introduce it to you, and who with great kindness afford me a platform to continue bringing very different trading and investment ideas to you. The power and reach of Financial Sense and its willingness to encourage “Uncommon Views” of markets, is great indeed. Without access to this marvellous publication, few would ever have heard of Daniel’s sacred numbers.

Our theme picture is the magnificent Sistine ceiling (1508-12) painting of the Prophet Daniel by Michelangelo.
Time
During the past 18 months I have introduced you to, and expounded upon the secret Danielcode price levels created in all markets, from the code found in the Book of Daniel. Those who seek knowledge will recall that we can forecast the price levels at which markets will turn from the matrix surrounding the numbers contained in this book of prophecy. In my article for Financial Sense of 03/19/2009, “The Number of the Beast”, I showed you how the Danielcode had called for the March 2009 low to be one of some importance in the S&P and other Equity markets. It has certainly caught some attention. The significance of the 666 price number in $SPX was lost on most, and although every week has bought more claims of ownership of that perhaps historic call as the rally has unfolded, only the Danielcode made the call in writing, to hundreds of members, accurate to the day and just 2 ticks. Only the Danielcode publicly issued a special alert to the 24,000 unique monthly visitors to its website that an important turn was to hand.
Many have asked for more insights into how I knew that turn was likely of great importance, and for those I branch with great trepidation into that most arcane of subjects, “Time”.
I say with great trepidation because “time” even more than “price” seems to stimulate the feeding frenzy of traders, investors and market mavens. Indeed, knowledge of the time of high probability market turns, in particular for the longer trading cycles will give you all the tea in China or Solomon’s Gold, depending on your innermost desires. Mine is tea.
For investors, pension funds and corporates such knowledge comprises the keys to the kingdom. That few know or understand how to calculate market time despite the plethora of promises that they do, is nicely amplified by almost all being wrong around the 2007 top and the 2009 March low.
And market time is different to our normal concept of time. Had you known how to properly calculate market time your 401(k) would not now be in tatters; major pension and sovereign superannuation funds would not have lost the billions that they have. Gold and Silver Bulls would not have been buying near the March 2008 highs, and currency hedgers would not have stayed short the US Dollar after that date. Indeed Warren Buffett would not have been a buyer of Conoco-Philips near the Crude Oil high of 7 in July 2008. All of these major turns were foreshadowed by the Danielcode and published by Financial Sense. Knowledge of market time is a vital precursor for successful long term investors. And pretty handy for traders as well.
To preface our exploration of the calculation of market timing, let me say that nothing in my writing is intended to diminish the work of others. Many others too, have dedicated large parts of their life in the search for the twin Grails of trading: price and time. That they are the same thing juxtaposed on different axis is not a new concept. WD Gann, under the tutelage of his mentor, the British astrologer and numerologist “Sepharial” advanced this proposition in 1935. Sepharial’s letters timing the cotton market and many of the other climatic (floods) and market events in Gann’s prophetic but strangely infantile book “Tunnel through the Air” have some minor similarities to this observation of market timing. But Sepharial camouflaged his observations by claiming that they were related to astrological cycles. Indeed they are, but he scrupulously avoided saying that all of these cycles are of Biblical origin. In so denying the source, both he and Gann missed the next step; the one more thing that brings these time cycles to life.
What do you think the wise men, sages and prophets of Biblical time were looking at on those myriad of long nights as they sat outside their tents? It wasn’t television or the latest mindless reality show on cable, and sadly for those ancients, Rugby had not been invented! Of much greater interest, they observed the stars and the heavens. And they wrote down, sometimes in code and sometimes openly, the great cycles of the heavenly orbs. The Bible records those cycles.
Sepharial used that knowledge but fudged naming the source because it wasn’t cool. And regrettably it’s still not cool today, in a world that worships that other great religion “Science” rather than God.
Daniel and Newton
I don’t hope to lure the scientific crowd with this connection. They too are a stiff necked and obstinate people, but I was vastly amused when one of my subscribers, a lady of mature years who is handling her portfolio nicely, wrote to say that she was delighted with the insights and results that she obtained from reading my articles on the Danielcode. She went on to tell me that she had asked her adult son, then a broker with Merrill Lynch, to trade an account for her based on the Danielcode trade signals. He demurred. As he advised his mother Ms D., he couldn’t begin to accept anything based on the Bible. It’s a common but foolish reaction. To deny something that you have not even tried is even sillier, but that’s what investors do every day. They put their faith in fib cycles and man made ratios, and absent a secular Bull market they lose their hard earned savings. Ignorance may indeed be bliss for some, but for investors, ignorance of the Danielcode time cycles will eventually make you dedicated to poverty! But, it’s your choice.
The Book of Daniel is an especially important writing. Isaac Newton, a lifelong Christian dedicated years of study and interpretation to the prophecy of Daniel and wrote a book just on this subject. You can read more at John Pratt’s excellent website quoted below. So we have the Prophet Daniel, living about 640 BC, who was an amazing mix of Prophet, Holy man, mathematician and high powered executive. He rose to become CEO of what is today Iraq, then under the rule of king Nebuchadnezzar, then his son, the Chaldean king Belshazzar, and finally king Darius. We see him being endorsed centuries later, by no less than the father of modern Science, Sir Isaac Newton, who wrote:
When I wrote my treatise about our System I had an eye upon such Principles as might work with considering men for the belief of a Deity and nothing can rejoice me more than to find it useful for that purpose.
Put another way, Newton believed that Science was the observation, measurement and recording of all the miracles and bounty of God, and that Science served to prove the Deity. Modern science largely rejects Newton’s purpose and makes the mere observation and recording of God’s endless miracles into the Deity itself. Discover a process; record and describe it; deny the hand of God in the making, claim it as your own and you will likely get a Nobel prize. The servant usurps the Master in their hubris and for their own glory.
Daniel was in the greatest credit amongst the Jews, till the reign of the Roman Emperor Hadrian. And to reject his prophecies, is to reject the Christian religion. For this religion is founded upon his prophecy concerning the Messiah.
Finally before we seek enlightenment from The Book, let us be aware of Newton’s cautionary words:
The folly of Interpreters has been, to foretell times and things, by this Prophecy, as if God designed to make them Prophets. By this rashness they have not only exposed themselves, but brought the Prophecy also into contempt. The design of God was much otherwise. He gave this and the Prophecies of the Old Testaments, not to gratify men's curiosities by enabling them to foreknow things, but that after they were fulfilled they might be interpreted by the event; and his own Providence, not the Interpreters, be then manifested thereby to the world. For the event of things predicted many ages before, will then be a convincing argument that the world is governed by providence. www.johnpratt.com/jpp.html
We are not called to be Prophets although the world badly needs a modern day Prophet. Nor do I wish to emulate what Newton rightly describes as the folly of interpreters. But, I can at the least expound the technique for finding high probability turns in “time”. And unlike Sepharial and Gann, I will show you most of the rules along the way. At the end you will not ne left wondering!
For the proper calculation of market time, it is irrelevant whether you believe the Bible as the source of all knowledge, or not. Most of you have probably never read the Bible from end to end. You should. It is the world’s storehouse of knowledge, but Solomon, the wisest man who ever lived, tells us that “The wise man's eyes are in his head; but the fool walketh in darkness: and I myself perceived also that one event happeneth to them all.” Ecc 2:14. So too with markets. Markets turn when and where they turn, and they turn for the wise man as well as the fool; the believer as well as the heretic. But the wise may know of the high probability time turns. The fool never learns. Those of you who are still reading are on the path to wisdom, be it as small as a grain of sand. Indeed Daniel’s wisdom and prophecy is for followers of all the world’s great monotheist religions. Paul details in his epistles how the Word was first for the Jew and then the Gentile. Muslims too hold Daniel to be a prophet. He is the man for all seasons
The Rules
The rules for finding Danielcode time turns are very precise, and all are Biblical in origin. Some from the Book of Daniel, some from Ecclesiastes, Genesis and Exodus.
All are exact and vital. Some are literal and some derived, but follow along and you are sure to be amazed.
Rule 1: Dan 12:11 And from the time that the daily sacrifice shall be taken away, and the abomination that maketh desolate set up, there shall be a thousand two hundred and ninety days. Dan 12:12 Blessed is he that waiteth, and cometh to the thousand three hundred and five and thirty days.
This is the Danielcode matrix. In these two verses are all the price and time ratios that markets, people and history use. They are the universal ratios of all life. And death.
Rule 2: Exo 23:12 Six days thou shalt do thy work, and on the seventh day thou shalt rest;
The Danielcode trading week which is our basic timing tool for the longer market cycles, comprises 6 trading days. This is a Genesis chart of the S&P index in which each “week” has 6 trading days.
Each bar contains 6 trading days regardless of what days of the week that rotates through. In it we capture the timing for each “true trading week” or “Danielcode week” as it is referred to here. It matters not that the modern world chooses not to labour as Moses commanded. This is how real Danielcode time is measured.

Rule 3: Ecc 1:9 The thing that hath been, it is that which shall be; and that which is done is that which shall be done: and there is no new thing under the sun. Ecc 3:15 That which hath been is now; and that which is to be hath already been; and God requireth that which is past.
From Solomon’s imperative we see that we are not looking for something new, but rather for something that has already been. Time cycles like price ranges are all fractals of earlier cycles and ranges. If we can accurately identify the minor cycles, we can reasonably expect to forecast the larger time cycles.
Rule 4: Ecc 3:1 To every thing there is a season, and a time to every purpose under the heaven:
All things have an appointed time. There is an appointed time for every event including turns in that most heterogeneous and heathen of inventions, financial markets. Ecclesiastes 3 is one of the most beautiful pieces of prose ever penned. It was even made into a chart topping pop song 40 years ago. Some of you will remember. You can read it in its entirety at the end of this article. You will be inspired.
Rule 5: Dan 12:7 And I heard the man clothed in linen, which was upon the waters of the river, when he held up his right hand and his left hand unto heaven, and sware by him that liveth for ever that it shall be for a time, times, and an half:
Once we have identified the operative time cycle, we are assured that our quest for knowledge lies at multiples of that cycle, “time, times” and “an half” of that cycle. That limits our choices pretty drastically. Unlike the Danielcode price targets with which most of you are familiar, the time cycles available for our time analysis are not infinite. Time cycles degrade as they move further from their source, as the true cycles run to four decimal points and our available charting methodology doesn’t allow accurate resets. At least for this article.
Danielcode market time can be measured from two points. The high and the high after the high. Inversely that means if we are seeking a high we usually measure from the low or the low after the low. The authority for this rule is also found in Ecclesiastes where you can read it for yourself. Note that this is diametrically opposed to Gann’s teachings which hold that the high before the high and the low before the low were paramount chart points. In a variation, we also see the count appearing from high to high and low to low. These counts are often terminal.
The Hunt for Danielcode Time Turns
To find market turning points in price, we create the Danielcode price levels and then look for market “recognition” of those numbers in a precise manner. Recognition may take the form of a vibration, a pullback or a complete trend change. Other studies guide us to those probabilities, but what is now indisputable, after 18 months of creating about 210 separate charts by hand each week, for a large, knowledgeable and critical audience, is that all markets turn within ticks of their Danielcode numbers.
Similarly, the process of “recognisable” time means that we look for markets to turn at known Danielcode sequences. The dominant sequences that apply to the S&P for the long term cycles that we are interested in here are the Danielcode numbers “on the square”, in reality, linear projections of 62. This ratio, easily calculated from the numbers in Daniel 12 is very close to a common fib number.
Of more importance are the Danielcode binomial numbers, particularly the 2nd and 3rd iterations of the primary Danielcode sequence. In whole numbers, these are 44, and 59. None of the binomial numbers are widely known or used by other analysts. They are not fibs or part of any mathematical sequence other than the Danielcode, so it should surprise you if Danielcode time is indeed observed. Let’s have a look.
The first and simplest of the Danielcode time cycles is equality of time periods, hence we often see a time fractal in a chart being repeated, thus “time” looks for “times”. Here is a simple example where we see “time” of 62 Danielcode “weeks” from low to the 2000 high being mirrored exactly to the low that occurred 62 DC “weeks” from the high. This chart starts its count from an obviously important low on 10/08/1998. The last leg of the 2000 bull market runs exactly 62 DC weeks into high. Since this market has vibrated (turned) at a recognised DC sequence we look for this period of “time” to reproduce itself as multiples and halves. Time, times and an half. And so it does. After the 2000 high we get the 12/22/2000 low at the “an half time”; the major 09/26/2001 panic low after the 9/11 attacks at “times” and 1 week off the 03/12/2003 retest low at the 3 “times” mark.

Simple so far. Our timing model in the next chart is counting from the Danielcode week of 09/01/2000, which appears on this chart as “the high after the high”. The run down into the 09/2001 low is 44 DC weeks and the next major high to low sequence which brings in the eventual low on 10/14/2002, is just one period short of the next DC time count at 59 weeks.
From the 2000 high the dominant time cycle switches from the square to the binomials. The 62 DC week cycle continues to run. Indeed it gives us some important countertrend highs and lows the last of which was the 05/21/2008 counter trend high at the 6.5 times or 403 DC weeks mark, BUT from the 2000 high the binomial ratios again become dominant, for reasons that are outside the scope of this article. Let’s continue the hunt from the 2000 high. Starting at the high after the high 09/01/2000 we get the 09/26/2001 low at 44 DC weeks, which we already identified as 62 DC weeks from the chart high at 03/30/2000. This low generated a 3 month rally. From the intermediate high at 05/22/2001, the next binomial number at 59 DC weeks gave us a time count that missed the final 2000 low by just 1 period.
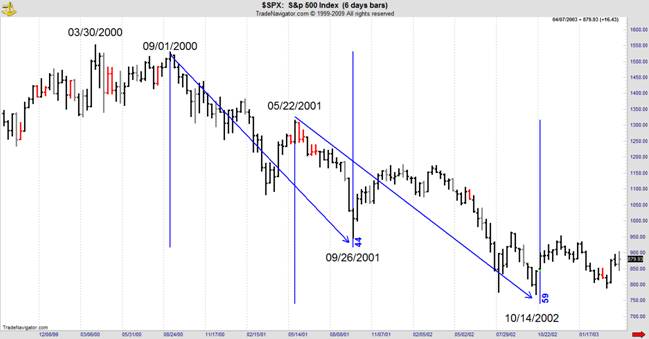
In this case we expected the high after the high to be the operative starting point for our time count because it is actually the closing high for the great bull market into 2000.
In the meantime, having identified a market turn at the 44 DC week mark from the closing high, we expect the probabilities to follow Daniel’s words of prophesy and cause the 44 DC week “time” to now seek “times”. And so it does as we see on the following chart by claiming the cycle low at 10/14/2002 exactly, while the old 62 week cycle goes on to claim the retest low at 166 weeks or 3 “times from its initial incarnation. Not on the chart is the 59 week cycle identified for the first time above, that expired in the week after the 2002 chart low. If you have noticed the cycles changing from 62 to 44 and 59 after the 2000 top, you are on to something.

Cynics will argue that this is just selective data fitting. And that’s always a good argument, particularly for those who dwell habitually in old habits and dark places. Then when the punters lose their lovely lolly they cry “But it’s global! How could I have known? A factual criticism of cycles or market timing is that dominant cycles can interchange and we know not when. Whilst fascinating and serving Newton’s purpose. we always need price action to confirm our idea. But some idea usually beats clueless.
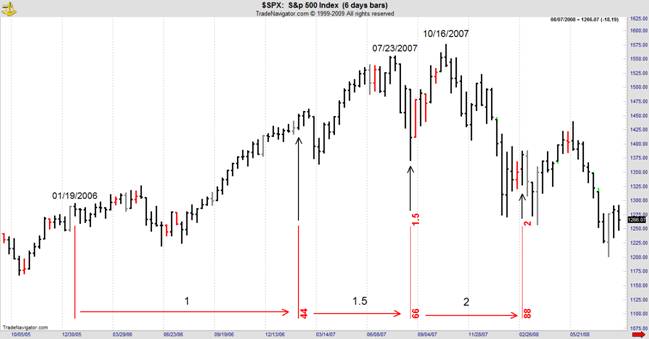
But I digress. If this is just data fitting then it shouldn’t repeat on another section of chart so let’s check that idea out by progressing to the next incarnation of a bull market, this of the “Goldilocks economy” and “new paradigm” beloved by those who know little and seek to learn less. We take up the count from the structures around the 2002 low to the eventual top in October 2007. We can time the major swings in this chart with just 1 of the DC sequences. Low to low sequence from the low after the low is marked in red, low to high sequences from the chart low are marked in blue and the final high to high sequence is in black. The 59 DC “week” cycle shows its dominance by marking both the first major high and low coming out of the market structures around the 2002 lows.

So far we are just looking for 1 hop or the initial cycle. Once we have “recognised” DC time cycles (and that recognition must be precise), defining the major swings, we can then extend these according to our “time, times and an half” rule. The chart below shows the results.
The ultimate high, appeared just 1 DC “week” from its projected date of 10/08/2009, from the high to high cycle from 05/11/2006, a variance of 1.69% which defies statistical probabilities and along the way we got most of the important turns exactly. But it gets better.

In previous articles and in the DC Trading Manual, available to all at the Danielcode website, I have told you that one of the quirks of the Danielcode is that it can complete its target recognition on a close only basis rather than the more usual formation of a swing high or low. And that’s what happened at the 2007 top. The closing high came in the DC week of 10/08/2007. That makes the variance to our high probability forecast high exactly ZERO!
All important market turns occur at fractals of known Danielcode time cycles. The 07/23/2007 top was very important. It gave us the 185 point pullback that overbalanced price, and was dramatic enough at the time. In the chart below, you can see that top occurring at 3 separate DC time counts. All are valid but our dominant cycle count of 59 DC weeks does not appear, so that made it an unlikely candidate for a final top.

My student Roger H from Redding, CA., who you met in an earlier article (holding the noble trout), would argue that this is a case of Amos 3:3 in action. Work that one out for yourself. It’s a tidy argument and many analysts have adopted it with success, without having a clue as to its origin!

Underlying the dominant DC cycle, the beat goes on, with the lesser cycle numbers giving us the counter trends and minor turns. At the first appearance in the new bull market of our old friend 44, which starred in the previous dot.com bust, the closing high for the first move came one bar late, but it was right on target to identify the “time and an half” low four DC weeks after the 07/07 penultimate top.
Do you still believe in Random Walk Theory, or fibs? If so, come on Down Under. I have a nice Harbour Bridge that I can sell you. Cheap too!
Punch Line
Here’s the punch line. If you have followed this exposition so far, you know that the next step in the process is for the odds to favour that the final evolution of Danielcode “time” into the 2007 top in the S&P index will seek “times”. Remember this?
Dan 12:7 And I heard the man clothed in linen, which was upon the waters of the river, when he held up his right hand and his left hand unto heaven, and sware by him that liveth for ever that it shall be for a time, times, and an half;
03/05/2009 was the daily closing low of the March down leg. I had been expecting this low ever since the 2007 top. Like all price and time cycles, the Danielcode “weekly” chart can be reduced to its fractals and internal ratios. When refined to daily bars it is a major input into our now famous T.03 signals. You can read in “The Number of the Beast” how those signals led me into the high confidence, and public call for 03/06/2009 to be an important low. The call was made on the Sunday for Monday’s open. Not so surprising really when you can see how all markets are ruled in price and in time by the Danielcode.

And that’s the simple version. Astute observers will have noted that our earlier 44 DC count gave 3 times its sequence at the March 2009 low. The count from closing high to closing low was 59 DC weeks and the count from chart high to chart low was also 59 DC weeks.

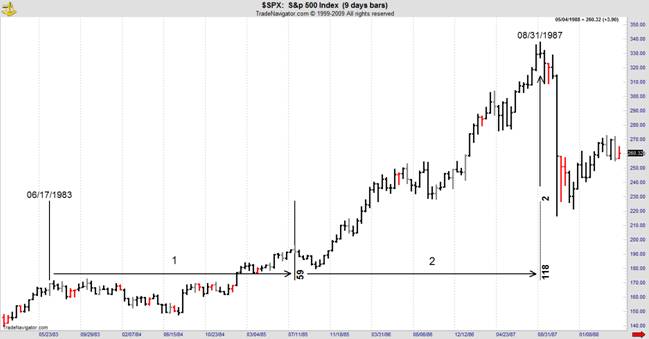
How long has this been going on? The next chart is the high to high to high DC count for the 1987 crash. The stock market crash of 1987 was the largest one day stock market crash in history. The Dow lost 22.6% of its value or 0 billion dollars on October 19th 1987! The market was running at a slower tempo then, so to simplify the chart for you, I have used our same “time, times and an half” rule but applied it this time to the DC weekly count. On the following chart our base time period is 6 days and an half. It’s all wheels within wheels Eze 1:16. We obtain exactly the same result by using fractals of the DC sequence on the 6 day “week”, but this method is simpler.
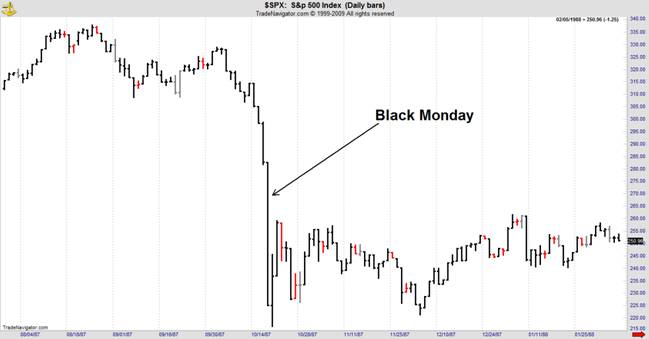
If you don’t think that was such a big deal, here is the daily chart of Black Monday. I traded through it! Something like this occurs when the dominant cycle and its high to high count conspire.
Spare a moment to think of the endless comments, interviews and words by the million that shaped the 2007 top and the March 2009 lows. Through all the conjecture and guessing, and in the process the destruction of much of your, and the world’s wealth, the Danielcode knew. It always does.
Prophecy, precision, and for those who don’t know, apparently chaotic markets. It’s not so. The Hand of God is everywhere. You just need to know how to look. Economists can opine and commentators can muse and guess. All of that is harmless entertainment. But only traders can trade. For us precision is paramount. For investors long time cycles are vital. You all know that now. As I have told you, markets fluctuate; sometimes violently. You need to know about the high probability cycles that trigger market Tsunamis. You need to know when “it” will happen. Time cycles repeat. All of this will happen again someday.
I hope you have enjoyed this brief introduction to Danielcode “Time” and the proper construction of time cycles. I hope you are amazed. I am; continually. And what I have shown you today is just the skeleton, the smallest glimpse of proper market timing. With understanding and diligence we can identify the high probability time for almost all major market turns, months in advance.
I invite you to visit the Danielcode website where we strive continually to disprove the myth of Random Walk. Ask your broker, financial advisers and pension fund managers to study this article on Danielcode “Time”. And show your politicians. If a humble country Lawyer from Down Under knows this stuff, isn’t it about time that those who handle your money knew it too? Now that would have saved everyone a lot of grief and heartache.
Recall where we started this journey: “He gave this and the Prophecies of the Old Testaments, not to gratify men's curiosities by enabling them to foreknow things, but that after they were fulfilled they might be interpreted by the event; and His own Providence, not the Interpreters, be then manifested thereby to the world. For the event of things predicted many ages before, will then be a convincing argument that the world is governed by providence.” Sir Isaac Newton
I trust you agree.
Ecc 3:1 To every thing there is a season, and a time to every purpose under the heaven:
Ecc 3:2 A time to be born, and a time to die; a time to plant, and a time to pluck up that which is planted;
Ecc 3:3 A time to kill, and a time to heal; a time to break down, and a time to build up;
Ecc 3:4 A time to weep, and a time to laugh; a time to mourn, and a time to dance;
Ecc 3:5 A time to cast away stones, and a time to gather stones together; a time to embrace, and a time to refrain from embracing;
Ecc 3:6 A time to get, and a time to lose; a time to keep, and a time to cast away;
Ecc 3:7 A time to rend, and a time to sew; a time to keep silence, and a time to speak;
Ecc 3:8 A time to love, and a time to hate; a time of war, and a time of peace.
Copyright © 2009 John Needham


