


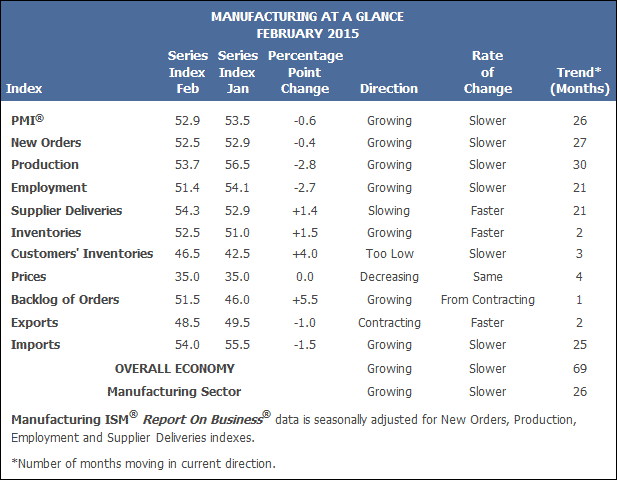
Today the Institute for Supply Management published its monthly Manufacturing Report for February. The latest headline PMI was 52.9 percent, a decline from the previous month's 53.5 percent and below the Investing.com forecast of 53.0. This was the lowest PMI since January 2014, thirteen months ago.
Here is the key analysis from the report:
"The February PMI® registered 52.9 percent, a decrease of 0.6 percentage point from January’s reading of 53.5 percent. The New Orders Index registered 52.5 percent, a decrease of 0.4 percentage point from the reading of 52.9 percent in January. The Production Index registered 53.7 percent, 2.8 percentage points below the January reading of 56.5 percent. The Employment Index registered 51.4 percent, 2.7 percentage points below the January reading of 54.1 percent. Inventories of raw materials registered 52.5 percent, an increase of 1.5 percentage points above the January reading of 51 percent. The Prices Index registered 35 percent, the same percentage as in January, indicating lower raw materials prices for the fourth consecutive month. Comments from the panel express a growing level of concern over the West Coast dock slowdown, negatively impacting exports and imports and requiring workarounds and added costs."
Here is the table of PMI components.
I'm reluctant to put too much focus on this index for various reasons, but they are essentially captured in Briefing.com's Big Picture comment on this economic indicator.
This [the ISM Manufacturing Index] is a highly overrated index. It is merely a survey of purchasing managers. It is a diffusion index, which means that it reflects the number of people saying conditions are better compared to the number saying conditions are worse. It does not weight for size of the firm, or for the degree of better/worse. It can therefore underestimate conditions if there is a great deal of strength in a few firms. The data have thus not been either a good forecasting tool or a good read on current conditions during this business cycle. It must be recognized that the index is not hard data of any kind, but simply a survey that provides broad indications of trends.
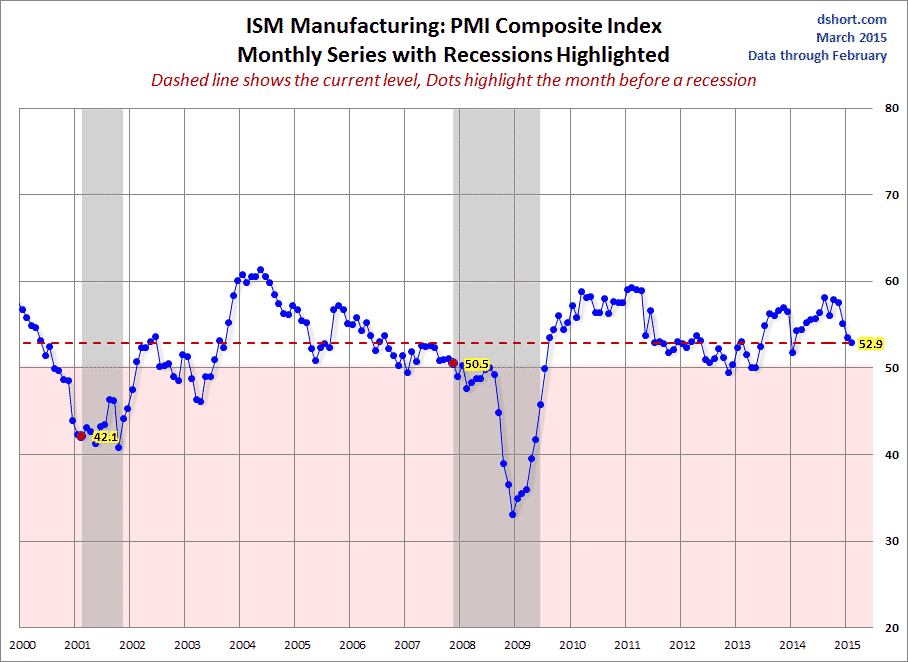
The chart below shows the Manufacturing Composite series, which stretches back to 1948. I've highlighted the eleven recessions during this time frame and highlighted the index value the month before the recession starts.

For a diffusion index, the latest reading of 52.9 indicates expansion. What sort of correlation does that have with the months before the start of recessions? Here are the eleven data points for the months before recessions arranged in numeric order. The latest data pointed (highlighted in bold) is higher than the level prior to nine of the eleven.
42.1, 44.8, 45.7, 47.2, 47.8, 48.5, 49.2, 50.5, 50.7, 52.9, 53.2, 66.2
How revealing is today's 0.6 point change from last month? There are 806 monthly data points in this series. The absolute average month-to-month point change is 2.0 points. So the 0.6 point month-over-month change in today's headline PMI number is below the average MoM change.
Here is a closer look at the series beginning at the turn of the century.
To reiterate the Briefing.com assessment: "The data have thus not been either a good forecasting tool or a good read on current conditions during this business cycle." The ISM reports nevertheless offer an interesting sidebar to the ongoing economic debate.
Note : I use the FRED USRECP series (Peak through the Period preceding the Trough) to highlight the recessions in the charts above. For example, the NBER dates the last cycle peak as December 2007, the trough as June 2009 and the duration as 18 months. The USRECP series thus flags December 2007 as the start of the recession and May 2009 as the last month of the recession, giving us the 18-month duration. The dot for the last recession in the charts above are thus for November 2007. The "Peak through the Period preceding the Trough" series is the one FRED uses in its monthly charts, as illustrated here.


