


Today the Institute for Supply Management published its latest Non-Manufacturing Report. The headline NMI Composite Index is at 53.4 percent, up 0.1 percent from last month's seasonally adjusted 53.4 percent. Today's number came in slightly above the Investing.com forecast of 53.2 percent.
Here is the report summary:
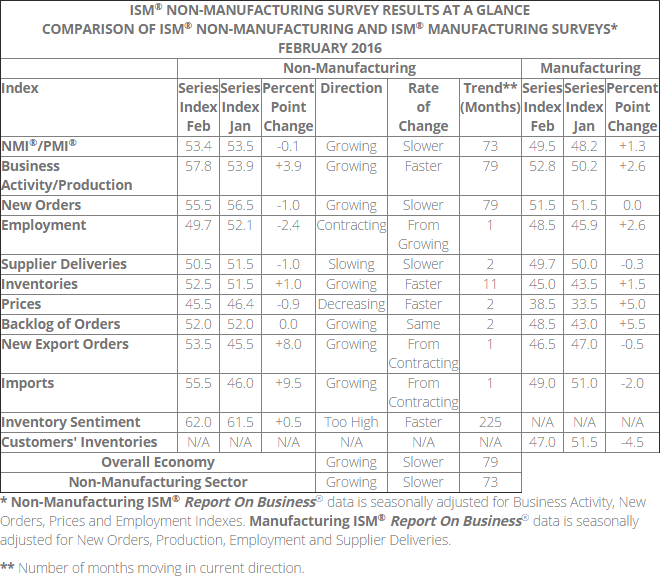
"The NMI® registered 53.4 percent in February, 0.1 percentage point lower than the January reading of 53.5 percent. This represents continued growth in the non-manufacturing sector at a slightly slower rate. The Non-Manufacturing Business Activity Index increased to 57.8 percent, 3.9 percentage points higher than the January reading of 53.9 percent, reflecting growth for the 79th consecutive month at a faster rate. The New Orders Index registered 55.5 percent, 1 percentage point lower than the reading of 56.5 percent in January. The Employment Index decreased 2.4 percentage points to 49.7 percent from the January reading of 52.1 percent and indicates contraction after 23 consecutive months of growth. This is the first time the employment index has contracted since February 2014. The Prices Index decreased 0.9 percentage point from the January reading of 46.4 percent to 45.5 percent, indicating prices decreased in February for the fourth time in the last six months. According to the NMI®, 14 non-manufacturing industries reported growth in February. The majority of the respondents' comments continue to be positive about business conditions. The respondents are projecting a slight optimism in regards to the overall economy. There is an increase in the number of industries reflecting growth in both New Orders and Business Activity; however, the NMI® has decreased slightly due to the contraction in the Employment index."
Unlike its much older kin, the ISM Manufacturing Series, there is relatively little history for ISM's Non-Manufacturing data, especially for the headline Composite Index, which dates from 2008. The chart below shows Non-Manufacturing Composite. We have only a single recession to gauge is behavior as a business cycle indicator.

The more interesting and useful subcomponent is the Non-Manufacturing Business Activity Index. The latest data point at 57.8 percent is up from a seasonally adjusted 53.9 the previous month.
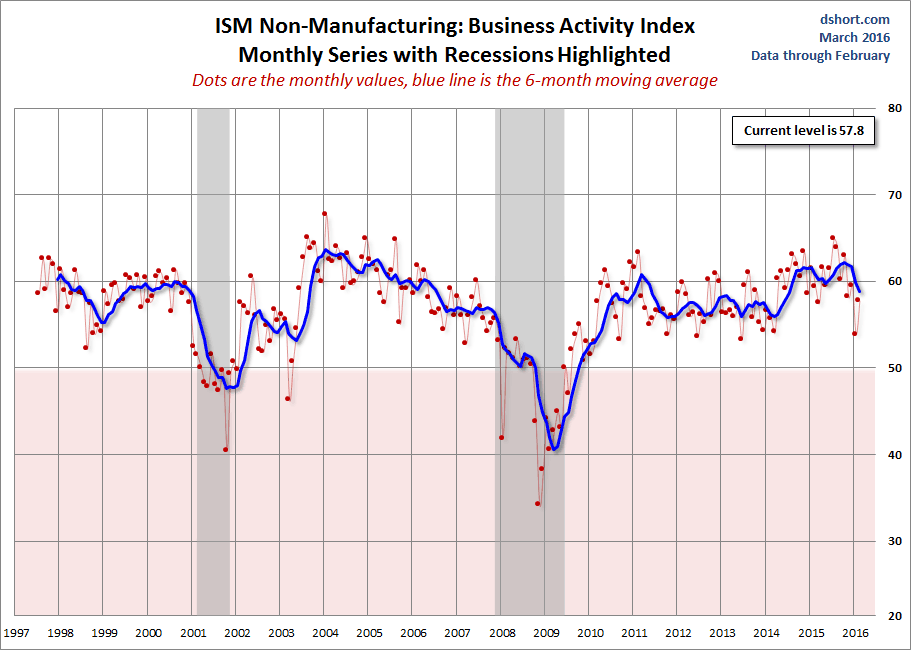
For a diffusion index, this can be an extremely volatile indicator, hence, the addition of a six-month moving average to help us visualizing the short-term trends.
Read also: ISM Manufacturing Index: Fifth Month of Contraction With Small Increase
Theoretically, this indicator should become more useful as the timeframe of its coverage expands. Manufacturing may be a more sensitive barometer than Non-Manufacturing activity, but we are increasingly a services-oriented economy, which explains our intention to keep this series on the radar.
Here is a table showing trend in the underlying components.
Here is a link to our coverage of the latest ISM Manufacturing report.
Note: We use the FRED USRECP series (Peak through the Period preceding the Trough) to highlight the recessions in the charts above. For example, the NBER dates the last cycle peak as December 2007, the trough as June 2009 and the duration as 18 months. The USRECP series thus flags December 2007 as the start of the recession and May 2009 as the last month of the recession, giving us the 18-month duration. The dot for the last recession in the charts above are thus for November 2007. The "Peak through the Period preceding the Trough" series is the one FRED uses in its monthly charts, as illustrated here.


