


As of February 2012, the 3-month SuperIndex is reporting a probability of recession around 5.3% while the Headwinds index is reporting zero percent probability of recession in 6-10 months’ time.
The traditional method for recession forecasting is to find an economic indicator or composite index that has a high correlation and adequately responds in advance to economic expansion or contraction. One then de-trends this indicator by taking a growth rate (straight or smoothed) over x-months and plotting that on a chart. When this growth rate (also called the first derivative) falls below a specific threshold you call recession. The value used for x depends on many factors but is normally chosen to maximise the recession dating capability of the resulting signalling system. It is normally taken over 3, 6, 9 or 12 months to cater for any seasonality that may be inherent in the economic indicator.
In order to de-risk ourselves from “model risk”, where such an approach might yield a recession signalling system that fails to call a recession because its growth rate signal just misses a certain threshold or when the growth rate just falls under the threshold and calls recession when there is none, we sought out a stylized methodology that would not rely on traditional growth rates for signalling recession. Essentially, we wanted a system that would eliminate model risk brought about by the use of numerical thresholds that worked well in the past but just get missed or overshot in the future “out of sample” data, resulting in false positives or false negatives.
A stylized approach looks at behavior of the indicator in a “pattern recognition” mode and assigns binary values to observed movements to determine if the indicator is in a rising or falling regime. When the indicator is identified to be in a falling regime, we call recession. The importance of the “pattern recognition” approach is to avoid looking at numerical levels of the economic indicator or its first derivative all-together and focus on directional movement only. In such an approach, the economic indicator moving up in one month may be allocated a “1″ and when it moves down it may be allocated a “-1″. The stylized approach would observe a series of 1′s, 0′s and -1′s to come to a conclusion as to whether we are in a rising or falling regime.
The binary nature of the discrete measurements of the economic indicators’ directional movement has several advantages.
Firstly, it is less subject to “marginal errors” whereby a growth rate would miss a threshold by 0.01 and erroneously make a recession or expansion call. Discrete movements “up” or “down” (+1 or -1) are less granular than a +1.032% rise or a 0.976% fall, but a threshold looking for 3 declines in an index is far less subject to marginal errors than a numerical growth rate that must fall below 0 to signal recession. In the latter case it is quite possible for the growth rate to fall to -0.05 and trip a recession signal, only for a data revision a month later to rise the growth rate to 0.1 meaning the prior month was actually not a recession! In this example, it is a lot easier for the numerical growth rate methodology to be revised upward by 0.15 (creating the dilemma we demonstrated in previous sentence) than for the prior month in the economic indicator to change from a down month to an up month (this would be one heck of a revision!) Also, should the stylized approach be looking at a series of monthly movements to make a regime determination it is even less likely that revisions would alter the series substantially enough to reverse a regime call.
Secondly, as we no longer rely on growth rate calculations, we are not subject to seasonality factors and assumptions that could bedevil such approaches.
Finally, a stylized approach is not susceptible to large “spikes” that can occur in growth rates, specifically short term ones. It is quite common for short term growth rates to plunge below zero, tripping a threshold, only to zoom up again the following month. There are many reasons these spikes can occur, especially in some leading economic data that can tend to “jump about”. A binary count of movements such as deployed by the stylized approach would not be susceptible to these spikes in data since it does not take the size of the movement into account, it only measures the direction of the movement.
Simply put, if we could find a stylized approach that examined discreet binary directional movement in an economic indicator over a certain window period to make legitimate and reliable “pattern recognition” regime change calls, and it ignored growth rate calculations of the said economic indicator altogether, we would have a nice diversified approach to traditional recession forecasting. We could then deploy the traditional “growth rate” models alongside the stylized models to enhance the accuracy of our recession calls or build consensus models for recession dating.
A stylized approach to regime change detection at no point relies on levels, values or growth rates of the economic indicator– meaning it far less susceptible to optimizations and seasonality risks.
The Economic Headwinds Recession Forecasting Model
All 9 of the composite economic indicators used by the SuperIndex were tested for suitability to the stylized approach for an advance recession warning system. The best results were observed from the Conference Board Leading Economic Indicator (US LEI) The subsequent system we developed for the US LEI has been named the “PowerStocks RecessionAlert Economic Headwinds” model.
This model uses the new Conference Board Leading Economic Index’s’ (LEI) directional behavior (looking only at if it rose or fell) over a certain time period to derive how much “headwinds” the economy is accumulating and produces a “Headwinds index” that ranges from 0 (no headwinds) to 11 (extreme headwinds.) It only considers directional movement of the LEI and does not look at levels or growth rates as is traditionally the norm. It then uses a regime-changing pattern-recognition probability model to determine implied probabilities of recession in 6 months based on the level and trend (rising or falling regime) of the headwinds indicator. The model is startlingly accurate and produces a phenomenal lead to recession of 6.85 months on average, with a 4 months standard deviation.
(Click to enlarge)

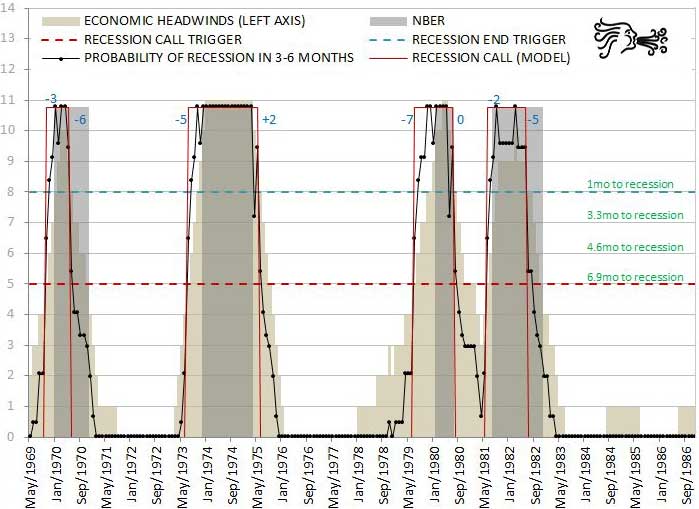
Headwinds Indicator, Recession Probability and Recession Calls
It would appear that once headwinds reach a certain critical threshold (level-5) the economy can never get its head back above water to overcome the drag and initiates a decline into eventual recession. Very much like the critical fertility threshold for human populations, below which the population never manages to regain growth and enters perpetual decline (Europe and Japan). A headwinds of 5 is equivalent to an economic stall speed. After the economic headwinds reach 5, we call a recession and then wait for the headwinds to fall below 8 before we call the end of the recession.
As the headwinds model is a completely different approach to recession dating to the SuperIndexes and most other recession forecasting methodologies, and is not dependant on levels or growth rates of the Conference Board LEI or seasonality factors, it provides a good diversification for us from “model risk”. The SuperIndexes only provide co-incident and short-leading (3-4mo) recession warning, but the HEADWINDS model forms the basis of our MEDIUM-TERM (6-month) recession warning methodology.
There is no leading index derived from the probability model as this is defined by the Conference Board LEI itself. The Headwinds model is focused on the headwinds indicator, implied recession probability and making recession calls only.
Unexpected Stylized Bonuses
A highly unique feature of the model is its ability to forecast the minimum time left in the current expansion or recession based on stylized facts of the behavior of the headwinds indicator during these two regimes. In the above chart we can see the current Headwinds indicator is at 2. We thus know that it would require at least another 3 sequential months of downward movement in the US-LEI to trigger a recession call. We also know the minimum lead we have ever witnessed in a recession call is 2 months (1986 recession). This gives the expansion 3+2=5 months “minimum time to live”. Using similar logic we can determine minimum time to live for recessions.
Another huge bonus from the stylized methodology is that set lead times to recession can be estimated depending on current level of the headwinds indicator. Between 5 and 8 the headwinds indicator in rising regimes provides average lead times to recession of 6.9, 4.6, 3.3 and 1mo respectively as shown on the chart below in green text. As Headwinds are rising we can “count down” the days to expected recession or economic cycle peak.
(Click to enlarge)
Such stylized approaches to forecasting are not available for infinitely variable numerical methodologies.
Calculating Implied Probabilities of Recession
We observe that the Headwinds Index (HWI) starts rising before onset of recession and is an excellent leading indicator. We also observe that the HWI mimics a smoothed probability curve, either in a rising trend or a falling trend ( if we assume high values that are moving sideways are part of rising trends.) This leads us to suspect that excellent implied probabilities of recession can be obtained from the HWI movement.
In its crudest form, we can calculate implied probability of recession by grouping all the historically observed HWI readings between NBER recessionary regimes and non-recessionary regimes and then for each reading we observe, simply look-up how often that reading occurred during recession as a percentage of all observations of that reading. The table below shows the results of this exercise for each possible HW reading from 0 to 11. We see that HW readings of 3 have occurred 39 times in the past, with 2 of the readings within a NBER recession and the rest in expanding economic situations. So next time we observe a HW reading of 3 we can conclude that the implied probability of recession is 2/(2+37)=5.1% The chart to the right displays the relationships of HW readings to similar implied probabilities of recession:
(Click to enlarge)

We note that there is indeed a very strong correlation between HW readings and probability of recession. The higher the HW reading the higher the probability of recession. We see that HW readings of 0,1 and 2 have NEVER occurred in recessionary periods in the past, whilst HW reading of 9 and above virtually guarantee you are in recession.
Improving Probabilities with Pattern Recognition
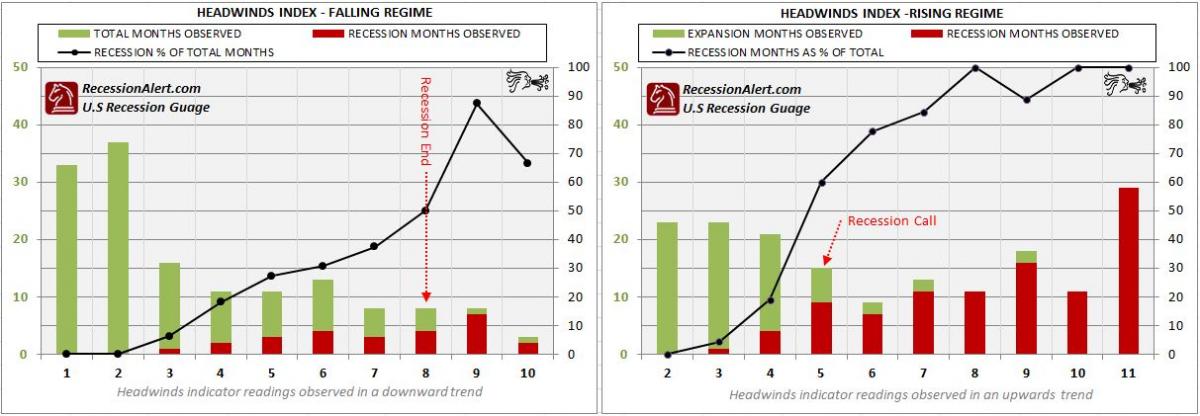
But we can go one step better. We can expand on the above exercise and further sort HW readings into rising or falling regimes (trends), to introduce pattern cognisance to the algorithm. A HW reading of 5, after having risen from 4 probably has a far higher implied probability of recession than a HW reading of 5 that has fallen from 6. It stands to reason that an observation of 5 can mean two different things depending on how we got there!
The new improved statistical table with HW readings sorted into rising or falling trends is shown below. Using the same exercise we concluded in the previous paragraph we see that each HW reading has a different implied probability depending if it was observed in a rising (2nd last column) or falling (3rd last column) trend. The last column is just a repeat of the rudimentary recession probabilities previously discussed to highlight differences brought about by pattern recognition.
(Click to enlarge)

As suspected we indeed see that a HW reading of 5, observed when it came from 4 (rising regime) has an implied probability of recession of 60%, whilst the observation coming from a reading of 6 has a far less implied probability of only 27%. Using the crude methodology, we would have concluded the probability of recession of 46% for a reading of 5. If the reading of 5 came from a reading of 6 (falling trend) then it would have given us a overtly pessimistic reading. The introduction of pattern recognition into the probability algorithm provides far superior, more accurate readings. The implied probability profiles of rising and falling Headwinds trends are displayed below:
(Click to enlarge)
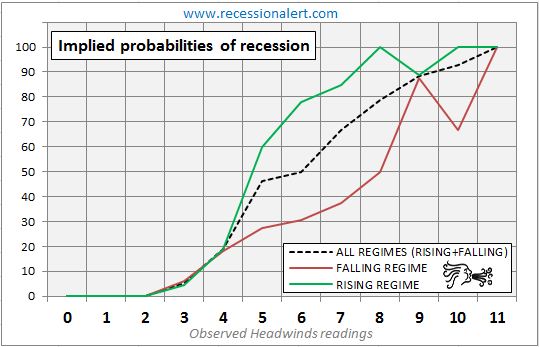
Headwinds Indicator Regime Probability curves
Note how the profiles for each regime are distinctly different. When we superimpose these probability profiles onto one chart as shown below, the differences become dramatically clear.
(Click to enlarge)
Choosing the Right Thresholds for Dating Recessions
These probability curves are the ones used to display the implied probability of recession on the Headwinds Recession Forecast chart. For each month we observe the Headwinds reading, determine if it is in a rising or falling trend and then depending upon this determination, look-up the probability of recession in the statistical table.
You can also see why the threshold of 5 was chosen for making a recession call. In a rising Headwinds trend this jacks probability from 19% to 60%. Similarly, a different value of 8 was chosen to calling the end of recession. When headwinds fall from 9 down to 8, probability of recession plummets from 87% to 50%.
Due to the “step-laddered” shape of the implied recession probabilities (a by-product of the binary and stepped nature of the make-up of the Headwinds Index) the granularity of implied probabilities is not as fine as what you have become used to in the SuperIndexes, but it is no less effective. To this end, as of February 2012, the 3-month SuperIndex is reporting a probability of recession within 3 months of around 5.3% whilst the Headwinds index is reporting zero percent probability of recession in 6-10 months’ time. However you can see from the Headwinds chart that economic headwinds are in a rising trend and sitting at 2 currently and although a reading of 2 has never before been witnessed in a NBER recession (hence the implied probability of zero) it stands to reason that risk of recession when headwinds are 2 are more than when headwinds are at 1.
Conclusion
Using a stylized approach not only offers us a recession forecasting system with zero false positives and a longer lead (warning), but it also diversifies away our “model risk” from the traditional growth-rate approaches.
In addition, stylized facts about the known and possible movement of the Headwinds indicator allow us to compute “minimum time to live” for any expansion or recession. It takes a full month for the Headwinds index to move up or down regardless of how much the economic indicator it is tracking moves up or down, so we can use this “stylized fact” to predict how many months are required to reach a specific objective.
Using pattern recognition on the Headwinds indicator provides for “lumpy but accurate” implied probabilities of recession.
However, the risk with this model is that it relies solely on the the Conference Board LEI. If this LEI breaks down or “loses its mojo” then it stands to reason so too will the Headwinds model. However, should the LEI start going wayward, those using traditional growth rate approaches are going to be far more susceptible to model risk than the stylized approach.
The Headwinds Indicator is available to clients as part of the PROFESSIONAL subscription only.
Dwaine van Vuuren is CEO of PowerStocks Investment Research, a South African-based provider of investment research. If you would like to receive the next 4 weeks SuperIndex Recession Reports for free, just email us at research[at]powerstocks[dot]co[dot]za with FREE SUPERINDEX FINSENSE in the subject line.
EXTERNAL RISK EXCLUSION : Recessionary risk from possible external shocks have not been built into the probability models, namely a steep and protracted Euro-area recession, an EU member sovereign default or credit event, hard landing in China, failure by congress to reach agreement on deficit reductions, further possible U.S credit rating downgrades, Iran tensions/conflicts and oil-price shocks. The probability models just look at what we are seeing in the US economy itself and do not take into account these external factors (since in our view, this would be speculation and we just want to deal with hard real numbers.) Should these external shocks come to light or their risks elevate, they will certainly show up in the US economy, economic indicators, and then be detected by our models, but until then we do not speculate on the probability of these external risks. Please note our SuperIndex shows the current economic recovery to be SUB-PAR, meaning it is vulnerable to external shocks.
IMPORTANT DISCLAIMERS : Although many of our models rely heavily on back-testing, optimisation and probability methods, please note that past performance is NO GUARANTEE for future returns. No system devised by man can perfectly predict the future all the time, let alone the future of the markets and economies. What we have are sets of mathematical models that use historical data and varying hypotheses to pinpoint places in time when the STATISTICAL LIKELYHOOD of calling the start and end to recessions is the greatest. In the midst of all the best mathematical models, you can have geo-political events, wars, terrorist attacks, natural disasters and even nuclear accidents that tip everything upside down. This is always a risk factor you need to factor in on any recession call no matter how confident you are in a signal. The SuperIndexes are created through mathematical and statistical optimisation techniques that best fit the historical NBER data. There is no guarantee that out-of-sample performance will match that of prior in-sample performance.
Source: Recession Alert


