


The following is an excerpt of the Browning Newsletter, a key source of information in describing the relationship between macro weather-related trends and their potential impact upon energy, commodities, and the wider global economy. To subscribe to her monthly newsletter, click here.
The economic impact of the El Niño is widespread. It is benign for most of US agriculture and lowers winter heating demand for most of Canada and large portions of the Western and Northern US. However, the impacts on other portions of the North American economy are not as favorable.
According to NOAA analysts, nearly 25% of the US GDP is directly or indirectly affected by weather and climate. El Niños usually provide a favorable climate. Their impact is less benign on other North American countries.
Remember, no two El Niños are exactly alike. A number of studies in the 1990s and early 2000s examined the economic impact of these climate events. Investors felt that they understood what to expect. Then came the El Niños of 2004 and 2009 — and the expectations were shattered.
Part of the problem is that the understanding of El Niños is new. It was only after the giant El Niño of 1982-83 that scientists realized the global impact of the event. The science on the behavior of Central Pacific (Modoki) El Niños versus the patterns created by classic official El Niños is still being generated and debated. The original economic studies expected more conformity.
Then the El Niño of 2004 arrived, a Modoki event. Like smaller Central Pacific events, most of its impact affected Asia not North America. It allowed heavy Atlantic hurricane activity to ravage Florida. California remained hot and dry, with soaring utility rates. The 2009 El Niño followed and the cold Arctic blast created by the polar eruption of Mt. Redoubt in April overwhelmed the normally warm El Niño winter. People began to consider El Niños as too unpredictable for investments.
They aren’t, but El Niños vary and basing investments on their patterns is not simple. They interact with other natural climate factors. History shows patterns, but investors must consider the odds. Current El Niño conditions appear to be developing into a classic El Niño. Most international agencies project a 70% chance of it developing this summer and an 80% chance of it lingering through winter. The majority now expect it to be moderate in strength. In short, it is the type of event that most of the old studies examined. It will have certain predictable effects on the economy. In the words of The Economic Impacts of an El Nino, a NOAA report written in 2002:
“Weather and climate sensitive industries directly impacted by weather (such as agriculture, construction, energy distribution, and outdoor recreation) account for nearly 10 percent of GDP. Further, weather and climate indirectly influence an even larger portion of the nation’s economy, extending to parts of finance and insurance, services, retail and wholesale trade, as well as manufacturing… El Nino affects important business variables like sales, revenues, and employment in a wide range of climate-sensitive industries and sectors.
Overall, total U.S. economic impacts of the 1997-1998 El Nino were estimated to be on the order of $25 billion.”
The following are some of the historical effects El Niños have had on the economy:
Agriculture
El Niños tend to have a beneficial impact on summer crops in the Northern Hemisphere, especially in the US and Canadian grain belts. Precipitation is plentiful and there are usually few, if any, heat waves. If there are production problems this year, it will be due to the cooler volcano weather we experienced during spring planting season, not the El Niño.
Winter crops fare less well. The phenomenon brings cooler wetter winters to southern states. Statistics show a drop in cotton production in the Southeast during El Niño years. Similarly, Central California fruit and vegetable crops have had problems with low temperatures. An average event historically lowers crop production by 1 — 2 %. (The cold in California should be balanced out by heavy, perhaps drought-breaking, rainfall.)
If the event lingers into springtime, it provides ample moisture and excellent cover for most winter wheat. However, the Western Provinces and parts of the Pacific Northwest historically have soil moisture deficits during their planting season.
An additional note, if the El Niño does last into spring, it should bring heavy rainfall to drought-stricken Texas and the Southern Plains. This would be particularly good for the cattle industry.
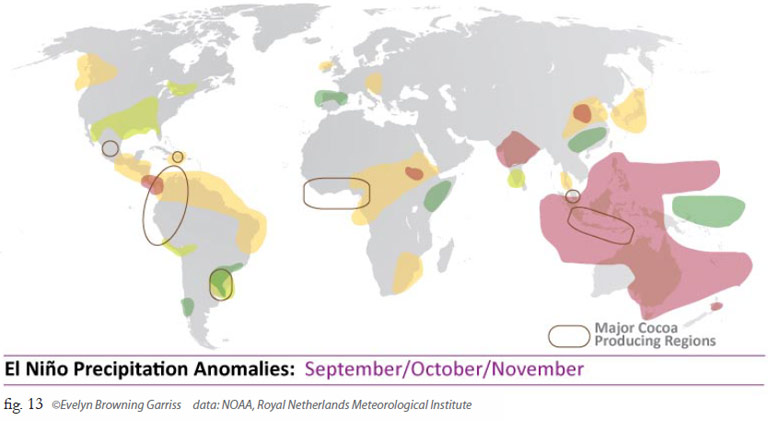
Typically, the most negative impacts of El Niños are on tropical agriculture — particularly in Indonesia and parts of Latin America. As noted in last month’s Newsletter, cocoa, coffee, cane sugar, palm oil and, in stronger events, rice suffer from droughts and floods. (The current event will probably not be strong enough to have much impact on West Africa and the IOD will help reduce some of the problems in Southeast Asia.)
Fishing
Changing ocean water temperatures have an impact on marine life. During the large El Niño of 1982-83, Pacific salmon populations dropped 20% and anchovies dropped 80%. Other marine life, from fish, to seals and bird populations, showed similar dramatic drops.
Even more troublesome, from a Canadian point of view, was that the warm waters drove fish populations north and American fishing fleets followed. International fishing disputes rise as marine populations move.

Energy
Typically, a classic El Niño limits Atlantic hurricane activity in Gulf of Mexico oil and gas production regions. Production facilities experience few work stoppages and little to no storm damage. El Niño conditions are still evolving, so this protection may not be as strong in summer, particularly late July and early August, as they could be in autumn.
El Niños typically produce warmer winter weather for Western Provinces and the northern states from the West Coast to the Great Lakes. Large El Niños warm the entire US/Canadian border region. The regions that face the most reliable warming tend to heat with propane and natural gas. Further east, the heating industry uses a greater variety, from gas to heating oil. Normally El Niños bring down demand for natural gas, causing lower prices for consumers and lower profits for producers. This winter, any lower demand for natural gas due to weather would add to the energy consumption drop due to the economic slowdown.
Historically moderate El Niños produce a “double dip” winter in the Eastern Provinces and Northeast and Mid-Atlantic states. These regions experience cold, even Nor’easter conditions in early and late winter but less heating demand in mid-winter when the warming impact of an El Niño has expanded to its greatest extent.
Electricity
El Niño events typically bring dramatic changes in precipitation that affect hydro-electricity. The Tennessee Valley Authority, for example, has historically shown that it has increased reserves and production capacity during these events. The same is true for most of the Southeastern states. Unfortunately, for British Columbia and the Pacific Northwest, the opposite is true and this normally leads to higher summertime electrical costs in California.
Cooler summers lower the Great Lake temperatures. Cooler waters are more effective in cooling coal and nuclear power plants, increasing generating efficiency for plants throughout the Midwest and Ontario. In addition, this year’s lake levels are higher than in recent years, thanks to the snows of last winter’s Polar Vortex.
Southern and East Coast utilities normally face increased wintertime ice and snow line damage during these events. (Even areas in Quebec and Ontario are affected.) Gulf States have more winter tornadoes and the Mid-Atlantic and Northeast usually have more ice storms. Additionally, moderate El Niños frequently generate late winter and early spring Nor’easters. During larger El Niños, the ice storms extend to Ontario and Quebec.
Real Estate
Warmer winters in Southern and Western Canada and the Northern tier of states allow more construction activity.
East and Gulf Coast properties face less risk from hurricane damage and northern properties incur less winter storm damage.
Hotter Western temperatures, however, increase fire risk in California and portions of the Northwest and Southern California face more property damage from heavy winter rains and mudslides.
In moderate to large El Niños, the southern tier of states face increased damage from heavy winter rains and the central to eastern Gulf States have more winter tornadoes.
Insurance
El Niños usually reduce insurance payouts due to hurricanes but can increase late and early winter payouts due to Nor’easters.
Crop insurance payouts are usually reduced during El Niño events.
Retail
Lower energy prices leave consumers with more money for discretionary spending. Typically Midwestern stores report between 5 — 15% increased sales during warm El Niño winters. However, this affects only some goods, since items like snowmobiles show declining sales.
If the El Niño continues into spring, however, it brings unusually cool weather to the East and Midwest. This hurts the sale of seasonal goods, such as gardening tools and spring clothing.
Exports/Imports
El Niño years are usually excellent for US agricultural exports. Typically, US crop yields are good while their potential customers have problems. El Niños usually hurt agriculture in India, large portions of China, the Philippines and Indonesia. In 25% of these years, they hurt competing grain production in Canada and South America. Most El Niños concentrate their most severe effects in tropical regions, raising the cost of tropical imports, particularly cocoa, coffee, palm oil and, to a lesser extent, cane sugar.
El Niños change ocean conditions for shipping. Because the phenomenon usually suppresses Atlantic hurricane activity, the major impact is felt along the Gulf of Mexico and East Coast. The Gulf experiences calmer shipping conditions in summer and fall but stormier conditions through winter and early spring. Similarly, the East Coast has quieter hurricane and mid-winter conditions but a strong risk of Nor’easters during late winter and early spring. On the West Coast, there are more storms through California, particularly for Los Angeles and San Diego and quieter conditions for the Pacific Northwest and British Columbia ports.
Tourism
The changes in weather affect where the desirable tourist locations are.
In the summer, the lower Atlantic hurricane rate makes Yucatan, Mexico and Caribbean vacations a bargain.
Typically, the East Pacific hurricane season is more active, which can ruin trips to Baja and the Mexican Riviera. Toward the Central Pacific, however, drought conditions become more common, which means sunnier days but may blight tropical vegetation for Hawaiian trips.
Most El Niños see a boom in Western skiing and skiing equipment sales and a drop in skiing in the Midwest and Ontario. Eastern skiing varies according to the size of the event.
The current El Niño is a classic El Niño and will probably have many, if not most, of the economic impacts listed above. If 25% of the US economy is directly or indirectly tied to weather, an El Niño provides better weather than normal. Given the current problems of our times, it is good that we are facing a favorable “economic climate.”
News Notes
One of the first signs that the development of El Niño conditions has weakened slightly is that the Atlantic is more favorable to tropical development. As this goes to press, a storm drifted off the East Coast and hit hot water. It is now growing off the coast of Florida. The US National Hurricane Center gives it a 80% chance of becoming Arthur, the first named storm of the Atlantic Hurricane season. At the moment, it is battling dry air and wind shear. Whether the winds grow to a tropical storm or remain a tropical disturbance, it is expected to go up the East Coast during the first week of July, bringing heavy rains to Florida and the North Carolina coast.
Good news you may not have heard — the air we breathe is a bit better. NASA’s Aura satellite released pictures in the last week of June that show significant reductions in air pollution levels across the United States. In particular, at least one pollutant, nitrogen dioxide, has decreased substantially over the past decade.
The decrease is particularly prominent in the Northeast, the Ohio River Valley, and other major US cities. For example, NASA reported a 32% decrease in New York City and a 42% decrease in Atlanta between the periods of 2005-2007 and 2009-2011. This air pollution decreased even though population and the number of cars on the roads have increased. Congratulations — and as a reward to yourself, take a deep breath of cleaner air.

Location, location, location and some more good news — the sea ice surrounding Antarctica, hit a new all-time record high for areal coverage. On June 28, the University of Illinois at Urbana-Champaign’s The Cryosphere Today site showed that the ice encircling the Antarctica is 2.074 million sq. km (801,000 sq. miles). That is .99 million square kilometers more than average!
What! You thought the ice was shrinking. Look at Figure 15 and notice the tip of the peninsula sticking out of the growing ice. Guess what our satellite pictures show — the icebergs breaking off that peninsula. The ice on the peninsula is shrinking but the ice in East Antarctica is growing. Unfortunately, pictures of growing ice are too boring to make the news.

fig. 15 Southern Hemisphere (The Cyrosphere Today)
We are now hearing scientists telling us that the shrinking ice in the north is more important to global climate circulation than that pesky ice growing in the south. Tell that to the Aussies!
Just in case you head isn’t spinning, the latest science is showing that giant ‘whirlpools’ in the ocean are driving the weather. Giant swirls of water called mesoscale eddies, up to 300 miles (500 km.) wide carry huge volumes of water and heat across the oceans. Bo Qiu at the University of Hawaii has shown that they slam as much as 30 million tons of hot water against east coasts of continents every second. They are currently creating extreme weather in Japan and parts of Northern China. The science on the eddies is new — but could help us know where global heat will hit.
Source: Browning Newsletter


