


The following is an excerpt of the Browning Newsletter, a key source of information in describing the relationship between macro weather-related trends and their potential impact upon energy, commodities, and the wider global economy. To subscribe to her monthly newsletter, click here.
2012 was a bad year for the US insurance industry. From crop-destroying droughts to Hurricane Sandy, derechos and tornadoes, 11 billion dollar disasters slammed the nation last year. These cost an estimated 349 lives and over $60 billion in payouts according to initial estimates by the National Oceanic and Atmospheric Administration (NOAA). Appallingly, this is less than 2011, when the nation had 14 billion dollar disasters, or 2005 when the US was pounded by multiple hurricanes.
According to Swiss Re, a leading catastrophe reinsurance company, this year’s global insurance payouts for disasters, totaled $140 billion. This was less than 2011’s total of $380 billion — the highest in history — or 2010’s $218 billion.
As a new study in Science pointed out, weather and climate related insurance losses today average $50 billion a year. According to the study’s author Evan Mills, a scientist in Lawrence Berkeley National Laboratory, “These losses have more than doubled each decade since the 1980s, adjusted for inflation.” Experts warn the insurance industry, the world’s largest business with $4.6 trillion in revenues, that things will get worse, with climate change likely bringing more (and more extreme) heat waves, droughts, floods and possibly hurricanes. According to Munich Re, North America saw the greatest increase in weather disasters compared with other continents, with five times more since 1980. Asia ranked No. 2, with a fourfold increase, and South America ranked last with a 50% increase.
It is increasingly important that nations and individuals heed the warnings for upcoming disasters and make preparations. Unfortunately, recent large-scale changes in the oceans have weakened these weather-warning systems.
The Problem With Natural Disaster Warning Systems
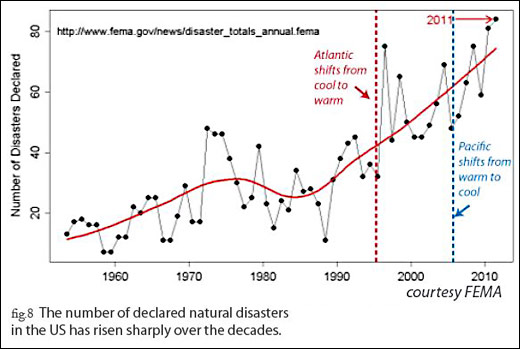
Long-term patterns in both the Atlantic and Pacific Oceans have been reversed. The oceans comprise 71% of the Earth’s surface. When they change − global climate changes. In 1995, the 60 – 70 year Atlantic Multidecadal Oscillation (AMO) became positive, warming the North Atlantic. Starting in 1999 and tipping in 2006 the 50 – 60 year Pacific Decadal Oscillation (PDO) reversed, warming the seas around Asia and Australia while cooling the American coastlines.
This not only shifted temperatures, but also altered precipitation. Since 1995 we have seen more Atlantic hurricanes and since 2006, more crop killing heat waves and droughts. Many of the patterns that we depended on have changed. Worse yet, the patterns that allowed governments to warn their citizens have changed.
During the five decades when the patterns were different, millions of people moved into regions that are now high-risk areas. (For example – over 50% of Americans moved to within 50 miles of the coasts – putting themselves and valuable infrastructure at increased risk from hurricanes.) Secondly, many of the protective structures, such as seawalls and levees, were not needed during the more benign 70s, 80s and early 90s and were allowed to deteriorate. Now these regions are at increased risk, with higher populations and inadequately maintained protection.
Remember – a “natural disaster” is usually the combination of a change in weather and inappropriate human action. We don’t declare a disaster if a wetland is inundated in a hurricane but drain the wetland, throw up expensive houses, wait for the next storm and now you get a ‘disaster’.
As for those managing and insuring risk, it is vitally important for them to understand which disaster warnings have become less reliable and what the new levels of risk are.
Drought
One of the consequences of the hotter Atlantic waters is that it created hotter summers in North America. In the process, it created a greater risk of drought. Part of this is due to the hotter ocean temperatures strengthening the equatorial trade winds, so that more tropical moisture blows into Mexico and less into the US interior. The other great cause of drought, however, is “flash droughts” such as we experienced in the summer of 2012.
A flash drought is when the main cause of drought is heat. The rainfall levels may be near normal or slightly below but the evaporation level is very high when the temperatures become very high. This summer the US experienced record-breaking heat in June and July and the evaporation rate in some portions of the Midwest was over half-an-inch per day. By August 60% of all US farms were in areas experiencing drought...
In the past, the main indication of drought was rainfall measurements. However, this has proven inadequate for warning societies in time to save their crops from flash droughts. By the time rainfall readings indicate a drought, the crops are dying.
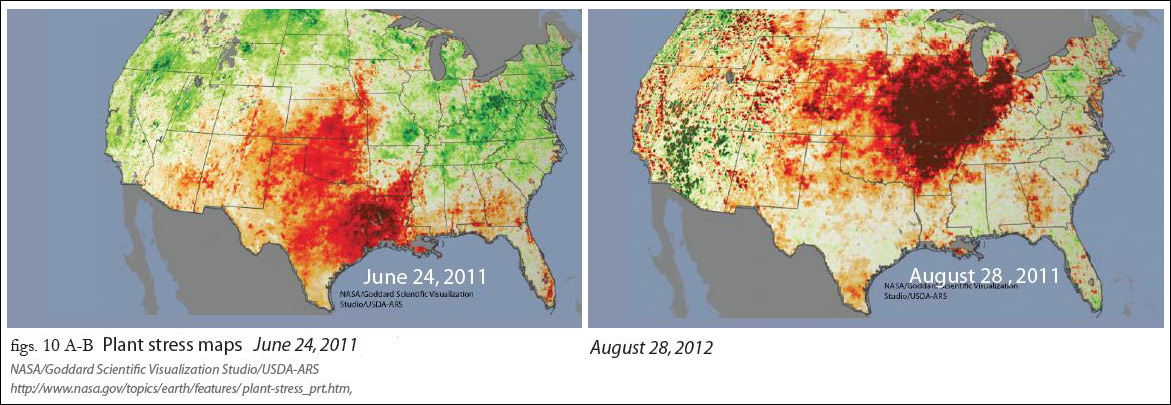
However, scientists at the U.S. Department of Agriculture developed a way to harvest numbers from NASA and NOAA satellites and turn them into a map of plant stress. A month before rainfall measurements or other drought indicators picked it up, some satellite data maps showed what was coming for the American South and Midwest: hot, water-stressed crops that eventually died under a prolonged drought.
In a December 5 NASA press release scientists announced that these plant stress maps could help the U.S. predict and prepare for drought sooner. They serve as an early warning, alerting scientists just as the crops start to run out of water. According to a recently released NASA statement, these earlier predictions can allow farmers to buy extra feed for their animals or adjust any contracts they sign. Similarly, businesses that utilize or insure commodities make appropriate adjustments for reduced crop productivity.

These satellite maps have another advantage. They expand the coverage of areas where there are fewer water gauges. One of the developing problems was reduced repair and replacement for US water gauges over the past two decades, reducing the amount of data for large areas of the nation. By contrast, satellites are able to record the conditions of individual fields anywhere in the U.S.
It is important to realize that this is not just a US problem. The current negative phase of the PDO has pushed cooler waters off the west coast of South America and warmer waters around East Asia and Australia. The gradually heating Indian Ocean and its own Indian Ocean Dipole cycle have increased the risk of flash droughts for the Eastern Hemisphere. However, these areas are also viewed with plant stress satellites recorders. Using the current technology, available on the internet, agricultural concerns throughout the world can have access to early drought warnings.
Hidden Hurricanes
The warmer waters of the Atlantic have also altered the nature of the Atlantic hurricane season. Hurricanes are heat engines, fueled by the energy of the hot ocean surface. The warmer Atlantic has provided more energy that:
- According to NOAA − doubled the number of tropical storms
- Allowed the storms to drift further north, retaining more moisture and strength. Some storms have even remained tropical long enough to cross the Atlantic and hit Europe.
- Energized the surface of storms near the ocean water, giving them tropical characteristics. This has produced “hidden hurricanes.”
This last point has created a problem for the National Hurricane Center (NHC), the agency in charge of warning Americans of approaching tropical storms.
Tracking tropical cyclones is a constantly evolving science, and many of the accepted methods used in the cooler era of the Atlantic have to be modified in today’s stormier era. The agency has used satellite data since the launching of TIROS in 1960. However, the warmer waters now energize the bottom of some storms, giving them tropical characteristics, while the top areas observed by satellites appear non-tropical. These “hidden hurricanes” created some real problems.
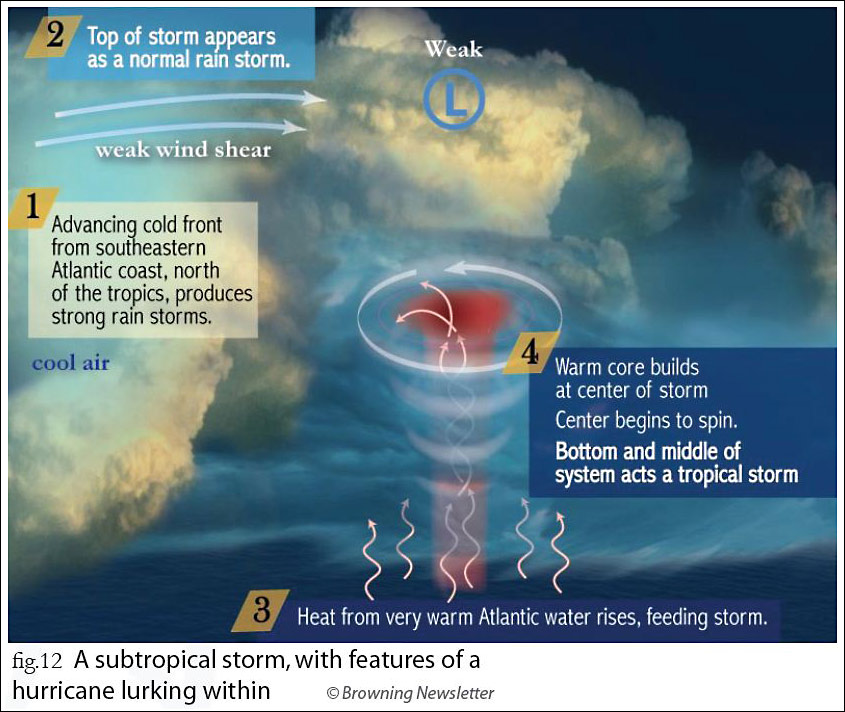
The first problem was the increase of subtropical storms. Initially these storms, which form when an extra tropical storm drifts over hot water and starts to become tropical from the bottom-up, were relatively uncommon. By 1972, the National Hurricane Center began to recognize them, since they sometimes evolved all the way into completely tropical storms or hurricanes. During the cool AMO era, subtropical storms were rare but as the Atlantic became warmer, they became relatively common during the beginning and end of the yearly hurricane seasons.
Initially, since they were different types of storms, subtropical storms were named and/or numbered differently from tropical storms. Unfortunately, if one of these storms hit you, it felt like a tropical storm. People hit by these storms were not prepared for their intensity or damage. Finally, in 2002 − seven years after the Atlantic had warmed −the NHC began giving names to subtropical storms from the same sequence as tropical cyclones. This alerted people to the potential danger of the storm and increased preparation, saving lives and property.
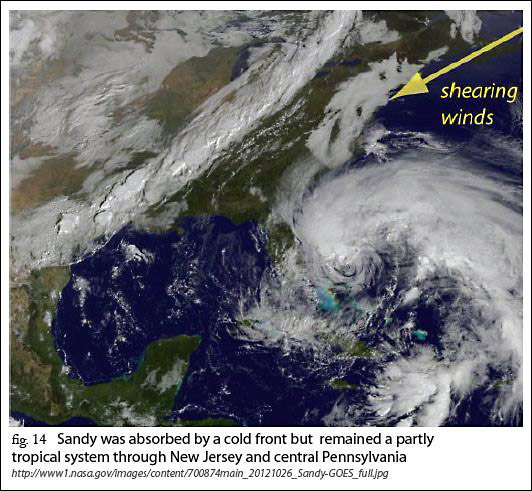
A second problem remained and we saw it in the coverage of Hurricane Sandy. Hurricanes have a life cycle. They start as a tropical or subtropical depression, and then as water warms and wind conditions improve they become tropical storms or hurricanes. When they drift over land and/or cooler waters, they lose their tropical characteristics and become extra tropical storms. Sometimes, however, a tropical storm like 1991’s “Perfect Storm” or Hurricane Sandy, is engulfed by a passing cold front. From a satellite’s point of view, they become extra tropical. However, if you are a hapless fishing boat or the Jersey Shore, they retain some of the dangerous characteristics of a tropical storm. Once again, a “Hidden Hurricane” hits populations without warning.

The NHC has always had the job of tracking tropical storms and hurricanes. Once the storms became extra tropical, reporting became the responsibility of other agencies. As Hurricane Sandy became absorbed by a strong cold front, a huge debate arose within NOAA over which agency should handle the storm and warn local officials. In the end, the NHC handed over operations to the local National Weather Service agencies. It is felt by many that the failure to issue official NHC Hurricane Warnings north of North Carolina resulted in confusion prior to Sandy’s arrival among the average public as to what sort of storm was heading their way. They were not prepared for hurricane force winds and life-threatening storm surges. The result was devastating.
Research by Florida State University Associate Professor Bob Hart reveals that Sandy remained a tropical system at landfall and through central Pennsylvania, in short – a “hidden hurricane.” While the National Weather Service, as late as December 13 was announcing that “Sandy warnings were clear and effective”, the agency has come under massive criticism. NOAA Administrator Jane Lubchenco announced that she will step down at the end of February 2013 (because she wants more family and academic time).
At this point, it appears that the NHC will modify or, in its own words “allow more flexibility” in reporting the track and warnings for post tropical storms in 2013. However, between the unknown impact ofthe potential Fiscal Cliff on NOAA’s operating budget and controversy within the agency, it is not known what sort of new policies will be designed.
Meanwhile, as long as the Atlantic remains in it warm phase, hurricanes, hidden or otherwise, will remain a major threat to North American property and lives. As Hurricanes Katrina and Sandy have shown, current warning and protection systems are inadequate for current realities.
El Niños and La Niñas
The impacts of droughts and hurricanes are local. The impacts of El Niños and La Niñas, the warming and cooling of giant areas of the tropical Pacific, are global. When millions of square miles in the Pacific are upper heated during El Niños, the tropical atmosphere is heated. This alters moisture contents, air pressures and wind patterns. The impact of this alteration is felt globally. Similarly, the impact of La Niñas changes weather throughout the world.
These widespread patterns have been studied for centuries. The Inca and Spanish Conquistadors noted the impact of the events on South America and in the nineteenth century the British discovered the impact on India. By the 1980s, scientists knew the global impact and began compiling sophisticated tracking systems that were excellent at projecting when the events would arrive. They had some difficulties when the ocean was neutral but were very good at trend spotting.

Unfortunately, El Niños and La Niños (the whole cycle of water and weather is called the El Niño/Southern Oscillation or ENSO) are not the only pattern in the vast Pacific. The PDO dominates the northern Pacific and modifies the impact of the ENSO on global weather. When the PDO is in its positive or warm phase, it enhances the impact of warm El Niños and minimizes the effects of a cool La Niña. Now the PDO is in its negative or cool phase and it is strengthening the extreme weather impacts of cool La Niñas. Warm El Niños have greater difficulty developing, are more frequently interrupted or shortened, and usually have a weakened impact on global weather, especially in the northern latitudes.
Just compare the range of predictions from the major scientific centers in mid-August (fig. 15A) with the current predictions (fig. 15B). Back in August, the tropical Pacific was actually experiencing weak El Niño conditions and weather, which helped bring enough August rainfall to salvage some of the US soybean crop. The consensus of dynamic models, which recently had the best tracking record, projected a moderate El Niño this winter. Now the majority of both dynamic and statistical models are equally divided on what the tropical Pacific conditions will be this winter (indeed the largest number expect a cool La Niña!) and the majority expect neutral conditions for spring and summer.

In short, a warning system that was designed in the era of a warm PDO is having problems coping with the new conditions of a cool PDO. What I have observed is that the system tends to be better at projecting cool La Niñas and has more problems anticipating warm El Niños. However, it is La Niñas like we had in 2007 − 2008 and 2010 – early 2012 that have the most negative impact on global crops, particularly crops in the US, Argentina, and southern China. The system, in other words, can be a useful warning for the most dangerous portion of the ENSO for US crops but is currently not terribly reliable for forecasting the benign El Niño.
These warning systems, which incorporate recent trends in their statistics, are still adjusting to the change in the Pacific and its effect on ENSO weather patterns. Since we are early in the cool PDO phase, the adjustments are not yet completely accurate. When one looks at predicted weather in the US and Canada, the impacts of La Niñas, particularly the severity of the droughts they bring, tend to be underestimated. Meanwhile the effects of El Niños are frequently overestimated, particularly the warming impact on northern states.
As noted in the first article, the El Niño conditions of last summer never lasted long enough to be classified as an official event. They did affect weather conditions, but then their impact receded and the US never received enough rainfall to reduce the drought. The current rainfall for the southern tier of states is more determined by the transitory MJOs, which vary in strength and the number of weeks they affect an area.
Fortunately, one can keep track of MJOs. Their current position is breaking any dry spell in Indonesia and creating dry weather in Northeast Brazil. They are bringing moisture to southern Brazil and Argentina and encouraging storms in the southern US.
Conclusions
With the changes in both the Atlantic and Pacific Oceans, there has been a change in the reliability of the global warning systems. The warnings for ENSO changes and hurricane damage have become less reliable, although agencies are responding and may show some improvements, particularly with tropical storm impacts, in the next two years. Meanwhile the warnings for droughts and their potential for crop damage have shown remarkable improvements.
This does not mean that insurance companies, risk managers and societies in general will be facing a near future of less extreme weather. However, there are warnings and knowing which warnings are reliable is the first step to intelligent management.

Source: Browning Newsletter


