


In my article Currencies - Long term forecast I analyzed the decline of the USD which started in the middle of the 1980's and continued until the end of 2009. The 30 year structure revealed a triangle like structure which I labeled as a large wave "B" that could be completed in a couple of years.
It is interesting to see how the large "B" wave that spans over 3 decades fits into the larger century structure. It also reveals that the future rise in the USD could be very large and possibly take a long time.
Since I was unable to find a complete chart for the USD over the last 100 years, I have tried to make a drawing to illustrate the development of the currency from 1920 to 2010 including my own forecast from 2010-2050.
A century view of the USD Index structure (The USD against a basket of currencies).
Actual 1920 -2010 Forecast 2010 - 2050
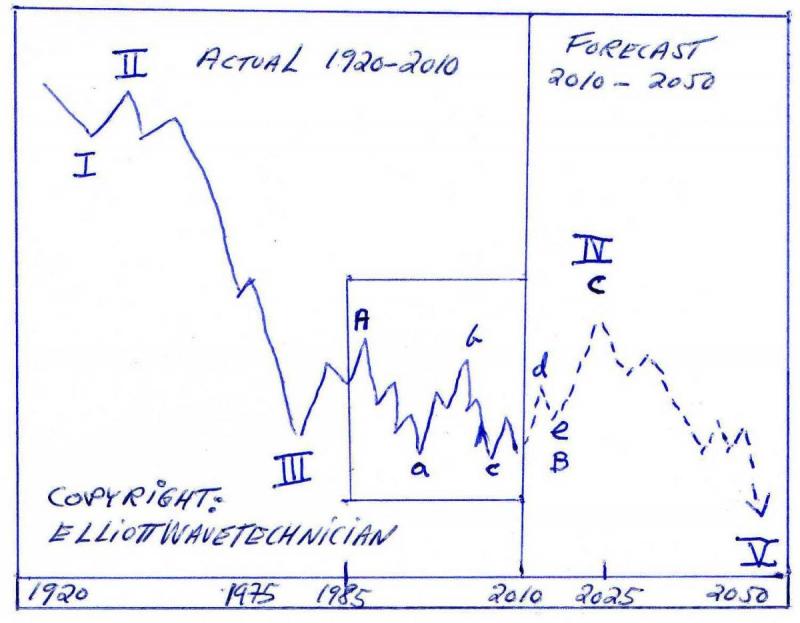
1920 1975 1985 2010 2025 2050
ElliottWaveTechnician 2009 all rights reserved. The box in the chart represents the years 1980-2010 which I have labeled as a "B" wave. This structure is analysed in more details on the next chart. The wave structure shows that the dollar has been in decline for the entire twentieth century. However, the big decline was during 1960's and 1970's which is labeled as wave III.
A 4th wave correction up since the late 1970's
The rise of the USD which started in the late 1970's is an "A" wave and ended in the middle of the 1980's.
A large "B" wave decline commenced from the middle of the 1980's and is still in progress but should be completed in a couple of years. Since an "e" wave correction in 2011/2012 can be shallow, most likely the historical low was in 2008.
The next should then be a gigantic rise in wave "C" shown with a rising dotted line. Given the size of the overall structure the "C" is likely to rise into the 2020's.
A closer view of the "B" wave structure in the USD
Multi year monthly chart of USD spanning 3 decades.

See the blue line that illustrates the potential future path of the USD. I believe this triangle like wave structure in USD is a large wave "B". As you can see a wave "d" (in blue colour) of the triangle is currently in progress. I have labeled the internal structure of the "d" with "a,b" and "c" in black colour. The first "a" and "b" have been completed and the USD is approaching the last wave "c" which will complete the larger "d" of the triangle.
A potentially long term rise
There is a possibility that the 4th wave correction since the late 1970's could divide into a larger structure like a triangle or a combination of different corrective structures. The rise of the USD could then last into the 2030's.
The interest rate cycle
Rising interest rates during the 1970's in the US halted the decline of the currency and gave support to the previous top in the middle of the 1980's The next high in the 54 year interest rates cycle is expected in 2033, so that decade could be the time for the next top in the USD should the correction divide into a larger structure. See further analysis of the interest rate cycle in my article The Kondratieff Cycle.
Going long the USD
The pattern for UUP is the same as USD. There are also leveraged vehicles to trade USD like the RYSBX (Ticker) which is leveraged twice the USD.
Copyright © 2010 Geir Solem


