


In a recent Bloomberg article, S&P 500 to Defy ‘New Normal’ and Rally, money manager Brian Barish of Cambiar Investors made a few important comments relative to asset allocation:
“If the whole stock market were a bunch of commercial real-estate investment trusts, they’d have a great argument [with the ‘new normal’],” he said. “We shouldn’t confuse the stock market with the U.S. economy. Particularly outside the U.S., a lot of structural issues just aren’t there, and U.S. companies get a lot of their revenue from outside the country.”
Barish said there will be a “multi-speed” market in 2011, as stocks in industries such as energy, consumer products and agriculture advance because “the revenue profile for those businesses has snapped right back to where it was before the great recession.” Financial and real estate companies may suffer because “it takes years, if not sometimes decades, for the economic landscape associated with bubbles to recover” he said (Full Article).
Our research aligns well with Mr. Barish in that (a) U.S. economic analysis and financial markets analysis do not have to align perfectly for investors to make money, (b) stocks are well positioned to move higher in the coming months, and (c) attractive sectors are highlighted by energy (XLE), industrials (XLI), materials (XLB), consumer discretionary (XLY), and technology (IYW).
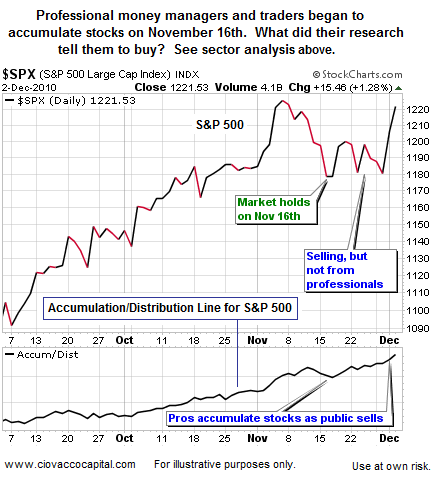
Professional money management firms of all shapes and sizes allocate a significant amount of time and resources to investment research. When it comes time to invest money, their decisions are based on that research. As shown by the accumulation/distribution line in the S&P 500 chart below, professionals have been accumulating stocks during the recent correction/consolidation period. Based on their research, pros have been buying energy, industrials, materials, consumer discretionary, and tech stocks consistently since early October, which also aligns well with our asset allocation models and research. The “market carpet” below shows the best performing S&P 500 sectors since the market found some footing on November 16th. The individual squares within each sector show the performance of individual stocks.
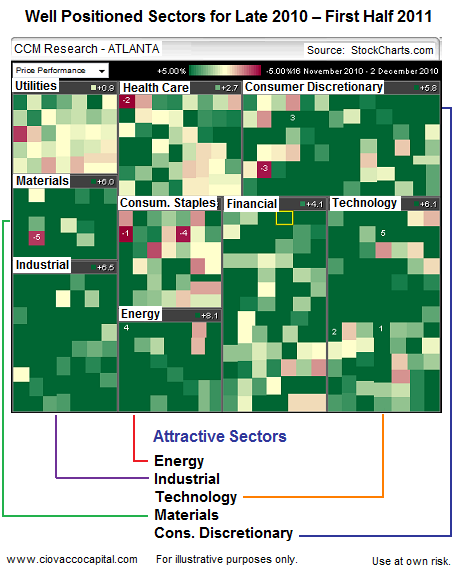
In the chart above, more green means healthier and probably more sustainable. A lot of green within a sector shows the sector had wide participation in the rally (bullish market breadth). Notice the high concentration of green in materials, industrials, and energy (lower left in chart above).
As we indicated on December 2nd, the S&P 500 has been battling with three key levels 1,175, 1,200, and 1,219. Each hurdle cleared by the S&P 500, especially on a weekly basis, increases the odds stocks will make a relatively significant move higher over the coming weeks and months. If we cannot hold above 1,219, then the bears still have an opening.
With Friday morning’s disappointing employment report in the U.S., the dollar is weak and precious metals are strong. What to watch in gold and in the U.S. dollar outline some key levels and indicators to monitor in these markets. We could see stronger buy signals in precious metals relatively soon.


