


 In today’s Outside the Box, Gary D. Halbert (my old and very dear friend and former business partner of many years) reminds us about a few significant facts concerning the Consumer Price Index (CPI) that mainstream economists and the media tend to ignore. The central question is whether the CPI is really indicative of the actual inflation rate. Not likely, says Gary, since the US Bureau of Labor Statistics (BLS), which compiles the CPI, has engaged in methodological shenanigans over the past couple decades (as has been well documented by John Williams of ShadowStats, among others). The upshot of all their monkeying with the numbers is that the official rate of inflation may be two to four times lower than the actual rate (which is rather convenient if you’re a government bureaucrat trying to hold down interest costs and Social Security payments).
These changes are hotly debated in academic circles. There are many economists who agree with the changes and can show with their models that inflation is low. That is the currently accepted wisdom, or what passes for it. The problem is that inflation only shows up, as one person put it, in the things we actually buy. If your main costs are food, energy, education, and healthcare (ring any bells?), then inflation is a great deal higher than 2%. Other items are actually falling in price. It comes down to the mix of items in the calculations and whether you buy into the concepts of substitution (if beef gets too expensive we buy hamburger rather than steak) and “hedonics,” which says that prices of products drop over time as quality and manufacturing efficiency improve, so the calculation of inflation should take this into account.
Which means you can have official inflation at a low level (or even falling for certain items), while the amount you actually spend out of your very real pocket is rising! And thus the debate.
Having refreshed us on the basic techniques of CPI massage, Gary turns to food and energy, which the BLS includes in “headline CPI” but omits from “core CPI.” He points out that while headline CPI jumped an unexpected 0.7% in February, core CPI rose only 0.2%. That is, food and energy price increases accounted for more than 70% of the rise. “Not good for the economy,” he notes.
And of course, this is all bad news for unwary investors, since
Those who believe that inflation is only 2%, when it may be 5-8%, may be making investment decisions that are almost guaranteed to erode the purchasing power of their money over time. This is especially true with low-yielding investments such as CDs, Treasuries, etc.
Gary wraps up by taking a look at “chained CPI,” which he explains as follows:
[C]hained CPI assumes that when prices rise, consumers will resort to entirely different products, rather than just seeking a cheaper brand. For example, if beef prices rise, chained CPI would assume that consumers might opt for chicken to save money.
The chained CPI debate is raging as we speak: I got an email from the AARP this morning, urging me to tell my Senators to say no to chained CPI being used to calculate Social Security cost-of-living adjustments (COLA) – sounds like they may vote today (Friday) on a bill to do just that. But as Gary points out, we either calculate benefits using chained CPI – which, yes, is tough on those living on a fixed income – or we eliminate the cap on salary subject to Social Security taxation (that is, we raise taxes). As Gary says, “Either way, somebody’s got to pay, and it might end up being a little [of] both.”
Finally, a quick note: I am doing a webinar on Tuesday for Mauldin Circle members. The current state of the equity markets brings back memories of 2007. As the market continues to reach new highs, stock selection on both the long and short sides requires considerable expertise. That is why I decided that now is a good time to introduce you to one of the leading long-and-short investment managers, Jacob Gottlieb, CIO of Visium Asset Management. During our conversation on Tuesday, March 26 at 12:00 p.m. EDT (9:00 a.m. PDT), we will find out what’s on Jacob’s mind – his investment themes and where’s he seeing equity opportunities on both the long and short sides.
If you are not aware of Visium, they are a premier long/short multi-strategy manager with over .7 billion in assets. It’s a firm I have been watching for some time. Bloomberg cited Visium as one of “The 100 Top Performing Large Hedge Funds.” Take a look at this recent write-up on Visium: “The Quiet Ambition of Jacob Gottlieb.”
You will need to register for this exclusive webinar through The Mauldin Circle. If you are a Mauldin Circle member and a qualified purchaser or an investment advisor, a webinar invitation has been sent directly to you by email. A replay will also be available to qualified registrants. If you are unable to listen in to the live discussion, be sure to register so you can receive the replay information. If you are not a member of The Mauldin Circle and are a qualified purchaser, please join today. Upon qualification by my partners at Altegris, you will receive an email invitation . I apologize for limiting this discussion to qualified purchasers and investment advisors, but we must follow the rules and regulations. I look forward to having you at this exclusive Mauldin Circle event. (In this regard, I am president and a registered representative of Millennium Wave Securities, LLC, member FINRA.)
Have a great week. I know mine will be eventful – daughter Amanda is due to give birth to granddaughter Addison on Monday!
Your thinking about the world Addison will discover analyst,
John Mauldin, Editor
Outside the Box
subscribers @ mauldineconomics.com
Is The Government Lying To Us About Inflation? Yes!
FORECASTS & TRENDS E-LETTER
By Gary D. Halbert
March 19, 2013
Consumer Price Index Jumped in February
On Friday, the Labor Department reported that the Consumer Price Index (CPI) jumped an unexpected 0.7% in February. This was above pre-report estimates and was the highest monthly reading since 2009. We should be very concerned, right? Let’s take a closer look.
Upon further examination, we find that if we subtract food and energy from the CPI, the cost index rose only 0.2% last month. It turns out that most of the big increase in the CPI last month was due to the sharp rise in gasoline prices. The experts tell us that due to the volatile nature of oil and gasoline prices, we shouldn’t include energy in the CPI. Ditto for food prices which can also be quite volatile.
I have always argued to the contrary, that food and energy prices do indeed need to be considered in the CPI. Think pocketbook: if gas prices rise .00 per gallon, and you have to fill up once a week, and it takes 20 gallons to fill up your car, then you have less to spend on something else that week, or less per month. Not good for the economy.
Some others disagree with me, arguing that you spend the same amount each month, and that if you spend more on gas, then you spend less on other things, but the overall economy gets the same amount of money from you one way or the other. Both points are valid.
But if you are trying to measure the true inflation rate, I maintain that food and energy should be included. Apparently the government agrees with me since they continue to report the headline Index including food and energy, and secondarily report what the Index was without food and energy.

The real question is whether or not the Consumer Price Index is really indicative of the actual inflation rate. I will argue that it is not a very good indicator with, or without, food and energy. At the very least, the CPI is controversial.
Why the CPI Is So Controversial
The Consumer Price Index (CPI) is produced by the US Department of Labor’s Bureau of Labor Statistics (BLS). It is the most widely watched and used measure of the US inflation rate. For years, there has been controversy about whether the CPI overstates or understates inflation, how it is measured and whether it is an appropriate proxy for inflation.
Originally, the CPI was determined by comparing price changes in a fixed basket of goods and services. Determined as such, the CPI was a cost of goods index (COGI). Over time, however, the US Congress embraced the view that the CPI should reflect changes in the cost to maintain a constant standard of living. Consequently, the CPI has been moving toward a cost of living index (COLI).
Over the years, the methodology used to calculate the CPI has also undergone numerous revisions. According to the BLS, the changes removed “biases” that caused the CPI to overstate the inflation rate. The new methodology takes into account changes in the quality of goods and “substitution.” Substitution is the change in purchases by consumers in response to price changes, and this alters the relative weighting of the goods in the basket. The overall result tends to be a lower CPI.
Critics view the methodological changes and the switch from a COGI to a COLI focus as a purposeful manipulation that allows the government to report a lower CPI. Most critics prefer that the CPI be calculated using the original methodology based on a basket of goods with fixed quantities and qualities. Doing so can result in a significantly higher inflation reading.
On Friday, the BLS reported that the CPI rose only 2.0% over the last 12 months. Economists using different methodologies (including the original methodologies) estimate that the real US inflation rate over that same period was anywhere between 5% and 8%. That’s a huge difference!
If Inflation is 2%, Why Are Prices Up So Much?
I read a good article last week from TIME Business & Money columnist Michael Sivy. He pointed out that his printer ran out of ink recently, and he was “shocked” to find that the same printer cartridge had gone up in price by 25% in less than a year.
While the government’s CPI has averaged only 2% since the end of the Great Recession in early 2009, many basic commodities have soared since then. Gold was 0 an ounce when the recession ended, and today it’s just over ,600. That’s an increase of 70% in four years, or an annualized rate of over 14%.
Of course, that’s just one commodity. How about a broader measure? The Reuters CRB Commodity Index, which tracks the prices of energy, coffee, cocoa, copper, cotton, etc. is up 38% over four years, or 8.6% at a compound annual rate.
The price of gasoline has gone up from .60 a gallon when the recession ended to around .70 today nationally. That’s a 41% increase in four years, or an annualized rate of 9%. Taxes have gone up almost as much. Federal, state and local income taxes have risen 35% over four years, an annualized rate of 7.8%.
Then there’s the so-called “Big Mac Index” that was popularized by The Economist some years ago. McDonald’s hamburgers are available in many countries and their prices reflect the cost of food, fuel and basic labor. The price of a Big Mac, therefore, can be yet another indicator of inflation in a particular country. Since the recession ended, the cost of a Big Mac in the US has risen from an average of .57 to .37, or 5.2% a year.
As the main grocery shopper (and cook) in our family, I am reminded several times a week how food prices continue to go higher. Take a look at this chart from the St Louis Fed.
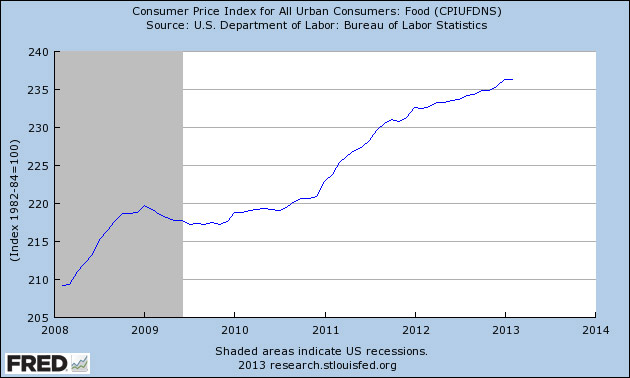
Consumer Price Index for All Urban Consumers: Food
And while we’re on the subject of food, have you noticed how many manufacturers reduce the size of the containers and/or packages so as to reduce the enclosed amount – but still charge the same price as before? I know I’m not the only one!
Severe Drought Led to Higher Food Prices
Forecasters lay much of the blame for higher food prices on the drought that swept through much of the US last year, and is continuing this year. Last year’s severe weather put nearly 80% of the continental United States in drought conditions – the worst in 50 years. Particularly hard hit areas include the Midwest states of Illinois, Iowa, Minnesota, Nebraska, Kansas, as well as Oklahoma, Texas, Arkansas and many parts of Colorado and California.
The drought damaged key crops like corn, wheat and soybeans while driving up commodity prices and forcing farmers to scramble to find feed for livestock. Farmers and ranchers have had to cut back on the number of livestock and poultry in order to limit their own costs, which created a shortage of beef, chicken and pork.
Although conditions have improved in some areas, roughly 61% of the country still suffers from drought, which is remains at its worst levels in more than a decade, according to the US Drought Monitor.
On a personal note, we are fortunate to live on beautiful Lake Travis, just outside Austin. Lake Travis is a Corps of Engineers man-made lake, and it supplies water for hundreds of thousands of area residents and countless businesses in Central Texas. As such, the lake level varies significantly, depending on the amount of rainfall we receive each year.
The drought in Central Texas is in its third year. Lake Travis, which is 65 miles long and over 200 feet deep in places, is now only 40% full (or 60% empty). As the water level falls, we have to push our dock out further and further to keep it in the water. A trip down to the dock is over 125 steps (one way)!
So How Is the CPI at Only 2%? It’s Not.
As we’ve seen above, the prices of many things that consumers buy on a regular basis have risen much faster than the CPI. So how can the CPI be at only 2%? And how could it have averaged just 2% since the end of the Great Recession four years ago?
Some argue that it’s because wages are down, and with the economy so weak, workers can’t demand higher pay to make up for their increased cost of living. Indeed, that’s one of the factors causing the decline in real after-tax household income.
Real median annual household income in January of this year was ,584 – or 92.7% of the level in January 2000. Incomes inched up early in 2012 but have been treading water since May, according to the Household Income Index. While household income ticked up slightly in the past year, it remains well below the ,008 level seen at the start of the recovery roughly four years ago.

These are all factors influencing the economic recovery (or lack thereof) and thus the inflation rate. But they don’t explain why the headline Consumer Price Index has hovered around 2% for the last four years, or why other inflation measurements are in the 5%-8% range. How can this be?
Quite simply because it’s a government report that’s been frequently manipulated over the last 35 years. Whether by design (my bet) or coincidence, these revisions have served to reduce the official inflation rate.
Also, keep in mind that our government has a record .7 trillion in debt it is paying interest on. If interest rates rise, it costs Uncle Sam more money. If inflation rises, interest rates follow. Obviously, the government has incentives to manipulate the official inflation rate lower than it really is.
The bottom line is that there is no absolute and objective gauge of inflation. Any particular measure is simply one way of making the calculation, based on a host of assumptions. We do know with certainty that a number of the costs that American households face are going up considerably faster than the CPI.
Finally, the fact that real world inflation is higher than the CPI poses challenges for investors. Investors should calculate their total required return net of the effect of inflation. As the inflation rate increases, higher returns must be earned in order to obtain a desired real rate of return.
Those who believe that inflation is only 2%, when it may be 5-8%, may be making investment decisions that are almost guaranteed to erode the purchasing power of their money over time. This is especially true with low-yielding investments such as CDs, Treasuries, etc.
Obama’s Olive Branch – “Chained CPI”?
Before we leave the subject of CPI, I think it’s important to discuss something going on right now in the budget negotiations in Washington. Over the shrill opposition of liberal Democrats, Obama has verbally offered to change the way cost of living increases are calculated for Social Security and other entitlements. Instead of the CPI now used, he said he might consider using something called the “chained CPI.”
In a nutshell, chained CPI is a measure of inflation that seeks to account for substitution by consumers when prices rise. While the current CPI measure uses substitution to a small extent, chained CPI assumes that when prices rise, consumers will resort to entirely different products, rather than just seeking a cheaper brand. For example, if beef prices rise, chained CPI would assume that consumers might opt for chicken to save money.
The end result is that chained CPI is generally lower than the current CPI used for measuring inflation. As I noted above, the CPI for the past 12 months was measured at 2.0%. The chained CPI for the same period was 1.8%.
If we switch to chained CPI for entitlement cost of living increases, which remains to be seen, it would mean that benefits would rise at a slower rate. Alan Greenspan recommended moving to chained CPI for Social Security back in his day at the Fed, but it went nowhere.
Liberal Democrats oppose the switch to chained CPI and demagogue it as a “war on seniors,” while Republicans feel it’s a way to save Social Security as we know it. Democrats prefer eliminating the cap on salary subject to Social Security taxation (read: increase taxes) to using chained CPI, which they view as a cut in benefits. It seems that only in a politician’s mind can a slower rate of increasing benefits be called a “cut.”
It’s still too early to tell how the current chained CPI debate will play out. This is one of those issues that hits both old and young. If chained CPI is used, then entitlement benefit increases will be lower. If it is not, then future Social Security taxes may well have to be higher. Either way, somebody’s got to pay, and it might end up being a little from both.
Hoping you stay ahead of inflation,
Gary D. Halbert
Like Outside the Box?
Sign up today and get each new issue delivered free to your inbox. It's your opportunity to get the news John Mauldin thinks matters most to your finances.


