


A Google search of “WD Gann” (1878-1955) returns 69,300 results and everyone of them is selling something. Gann would be amused at where his legacy has led as his prolific writing and charting has established a legion of researchers, authors and writers, most in search of Gann’s missing manuscripts and some professing to have discovered or rediscovered Gann’s secret of “time”, but even more are purveyors of his books, charts and quite amazing spiral numbers or number square charts. The prices asked for his voluminous commodity course would make Gann himself blush and he was a renowned asker in his day when some of his courses are reputed to have sold for the then equivalent of a new  car in the early 1900s.
Strangely Wikipedia no longer has a listing for Mr Gann and the previously loaded articles have subsequently been deleted, but there is a listing for “Gann Angles”. That such a famous name in the history of trading markets does not have a special place in this most useful research site is testimony to the fact that hardly anyone can agree on what Gann was saying, and the technique of Gann’s angles is the simplest example of his techniques, but it is only one of many. What we can agree on is Gann’s emphasis on buying low and selling high, an axiom of trading that is honoured more in theory than in practice (most can buy but few know the tops), but that is aspirational for all traders and investors. Whilst we don’t understand Gann’s methods we do know that he was very good at calling precise market turns and there is substantial evidence to support him calling precise tops and bottoms in stocks as well as commodities.
Gann’s principal contribution to technical analysis, his “angles” fused “price” and “time” into a simple and seamless process. On the chart below we see how time and price are represented on the vertical and horizontal axis of a two dimensional chart:

The angle drawn in red therefore has characteristics of both price (vertical axis) and time (horizontal axis). Gann’s simplest teachings held that these angles would measure markets in a predetermined ratio such as 1X1 where price would move 1 unit of price for every 1 unit of time. Other popular Gann angles were 1X4 and 1X8 being the angles on the square and the special 1X3 line which he referred to as the angle on the triangle. All of these techniques together with Gann’s background in Freemasonry combine to provide a fascinating treasure hunt for the elusive key that is missing from an understanding of how Gann’s techniques should fit together.
The missing key is in fact Gann’s mentor Sepharial, the nom de plume of Dr Walter Gorn Old (1864-1929) who was a notable 19th century British mystic and astrologer. Sepharial does have his own Wikipedia listing as follows:
 As a young man Sepharial initially studied medicine and followed this up with studies in psychology, oriental languages, astrology and numerology. In 1886 he started to write an astrology problem page in the Society Times, where he answered the public's questions, and in 1887 at the age of just 23 was admitted to the "inner sanctum" of the Theosophical Society. He was in fact one of the founder members of the Theosophical movement in England. Madame Blavatsky (whom he lived with until her death) called him "The Astral Tramp" because of his nightly explorations into the astral plane He became a very influential author in the fields of the occult, astrology and numerology, and his writings had a considerable impact on E. H. Bailey and Alan Leo, who he introduced to Theosophy.
He can be credited as the first astrologer to use Earth's "dark moon" Lilith in his calculations. Genuinely erudite, Sepharial had for example a greater knowledge of mathematics, astronomy, and historical methodology than most of his astrological contemporaries and this showed in his writings. Sepharial's "Degrees of the Zodiac Symbolized" foreshadowed Marc Edmund Jones's subsequent (and nowadays better known) work on Sabian Symbols.
It will come as no surprise that like many of his other assertions, modern science has failed to discover the Dark Moon which Sepharial claimed to have seen as it crossed the Sun, the only time when it was believed visible. However, for an astral traveler, no doubt realms far beyond science are possible.
Sepharial’s books “The Silver Key” and “The Kabala of Numbers” are essential reading for a deeper understanding of Gann’s work. Sepharial was a genuine intellect and his numbers chart for the New York Stock Exchange was the forerunner of Gann’s spiral number charts.
Sepharial’s vast knowledge of astrology is the basis of Gann’s little understood “Law of Vibrations” and in my view his most important assertion that “When time and price are squared” a turn in the market would result.
For Gann, market tops and bottoms came when time and price were squared and that had a variety of meanings. “Time” in Gann’s lexicon could be the point on an angle where market price coincided with the 1X1 or other angle; it could be one of the important numerology sequences that he used to such great effect in winning the Cuba lottery, then the world’s richest lottery, a reputed five times; it could be a time fractal, from the astrological chart ruling the market in question. Gann looked for these timing choices to occur on daily, weekly or monthly charts and most importantly he called any tradeable turn a market high or low. So in his sequencing of Union Steel for which he attracted early fame he calls minor, intermediate and major turns as market highs and lows.
There is no record of Gann calling the market high or low in real time although they are categorised as such in books written many years later. His supporters maintain that he forecast the exact top of cotton on 8th September 1927 in his very strange book “Tunnel through the Air”, published earlier that year. Many see signs of foreknowledge in that book but I must admit any attraction escaped me years ago when I read it during my “Gann phase”.
On balance, I adduce that Gann, like us, was adept at calling both minor and major turns but could not identify them as terminal tops or bottoms other than in hindsight. And that’s how it should be, as to think otherwise is to impute a level of foreknowledge, unknown in science or literature, to occur in mere mortals.
Gann, like the Danielcode created an infinite number of targets or support and resistance levels. Gann’s discovery that markets moved in fractals of 1/8th of previous price ranges should be a dominant plank of his claim to fame as markets, despite their evolution through derivatives, electronic trading and in many the change to decimal prices (in Gann’s day most stocks had a tick value of 1/16th), still routinely use 1/8th fractals of previous ranges as their boundaries. The most common fractals are 3/8th, ½ and 5/8th which of course give us the ratios of 37.5%, 50% and 62.5%. Put them on your charts. Markets use these numbers all the time. Gann failed to explain his rationale for using the sequencing in eighths, but I have laid it out previously for Financial Sense readers (see FSO archives).
For Gann these ratios were as far as he developed his price sequencing. For the Danielcode they are the base ratios but they are only the beginning.
We know that the most common of Gann’s time cycles were astrological cycles. That is a place where I have no wish to go. But time, cyclical or otherwise is key to a proper understanding of market turns and turns are our obsession at the Danielcode as they were for Gann. Given the growth of derivatives (and I refer here only to the regulated, non toxic version of futures and options), turns are fundamental to market entries. Leverage is a sharp sword for those who are wrong. To separate the infinite sequence of all possible price targets we need “time” as the other axis of our two dimensional chart to identify which of our targets will provide market turns. To do this and emulate Gann’s concept of squaring time and price, I share with DC members a subset of major market cycles called the T.03 time turns which I have introduced to Financial Sense readers previously. They are not astrological cycles and bear little relationship to Gann’s methodologies, other than being yet another method of measuring market time.
If this work is valid, and is not to be consigned to the “what are you smoking” pile of pseudo analysts, we must be able to point to its application in real time. This was a prime consideration in starting the Danielcode website 12 months ago when I began writing for Financial Sense. I had for years seen these turns in real time, with unparalleled precision, as true miracles, but I didn’t have hundreds of members to share them with, who could verify that the required time and price signals were available and posted before the event.
I do now!
On Friday 21st and Monday 24th instant I posted 18 T.03 “time turns” for members, in Equities, Commodities, DX and Forex.. Of these, 17 were elected and all made money. Most made big money and I share a sample of them with you below. Note how these turns come at a very precise conjunction of Danielcode price levels and T.03 time turns. Apparently time and price were squared at these points.
The full sequence of every one of these 17 trades are available for the scrutiny of Financial Sense readers at the Danielcode website.


The Equity and DX trades alone were worth some part of 0,000 per ONE futures contract on Monday night. They are worth a great deal more now! The three grains trades and the forex trades were a bonus.
Is that the low in Equities; the high in DX? We never know. Only market action will tell us that, but if you were one of the legion of traders searching for the low, this is probably as good as it gets with the Dow now up 1242 points from its Daniel number turn, the DAX up 587 from its DC number, and the QQQQ, Russell, DX, grains and others all contributing in varying degrees, but all handsomely.
For Gold traders, no doubt you are bemused and confused by the calls for Comex crashes, moon shots, the disparity between physical and Comex Gold and the many thoughts espoused by the Gold Gnostics. Some are well thought out and deeply insightful. Others are mere marketing puff.
At the Danielcode we actually trade these markets, so we need much more than an opinion. We need precise directional trading signals. The difference is crucial. The former is interesting cocktail chatter, the latter is trading for blood! So far our latest DC entry signal is showing nice rewards with Comex Gold up 3 from its last DC entry signal.
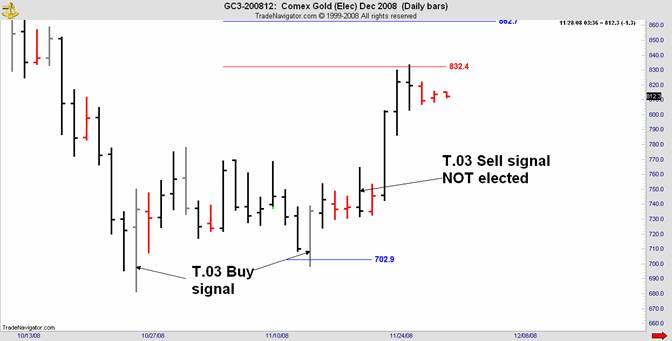
Even Mr Gann couldn’t do better than buy the lows and sell the highs. In Gold we bought both of the recent lows and got the intervening Sell signal in Silver as well. An interesting adjunct from the Gold chart below is how a non-elected Sell signal on 11/19 led to an acceleration of the upward trend. Many hold that a failed sell signal is a buy signal and vice versa, and although we see this phenomenon at work on our current Gold chart, the theory actually has limited application on backtesting.
More notably last Friday’s T.03 Sell signal in DX marked the precise high of the Dollar rally so far. Traders know that DX is the anti trade for Gold. and a Sell signal in DX, if elected, is always a Buy signal in Gold.
The concept of “election” of the T.03 time turns is explained in a short video under the “videos” tab at the DC website. That video and others together with the DC Trading manual are available free for Financial Sense readers.
Last week Gold elected the weekly Buy signal on the DC binomial charts so Gold bulls have reason to hope but the monthly chart still has a way to go to confirm that signal.
Even monthly turns start with a daily turn, and for traders the proximity to that turn is vital. As you see from our charts and posted entry signals the Danielcode knows. In fact this year, in Comex Gold, every turn on the daily chart, bar one, has been made within our allowable variance from the DC number. These signals are not of the black box variety, nor are they dependant on opening prices. The time turns for the next trading day are posted for members at the DC website about two hours after the US markets close, and the DC price levels are posted days and sometimes weeks in advance.
If your trading program didn’t alert you to the high probability lows, and now dramatic turns in the Equity markets last Friday, I trust that this article will serve to prove that important market turns are neither random or unpredictable. As Gann affirmed, they are made when time and price are squared. The Danielcode Buy signals in the Dow, QQQQ, Russell, DAX and even India’s NIFTY 50 stock index were all posted just hours after the US close on Thursday 11/20 when most markets closed on their lows and commentators’ cries of panic were shrill. For the Gnostics (those who know), this was a rare and rewarding opportunity. Danielcode members knew. I hope you did too.
Pro 20:15 There is gold, and a multitude of rubies: but the lips of knowledge are a precious jewel.
Copyright © 2008 John Needham


