


The unfolding story of the US Dollar's daze and its counter intuitive reaction to Wednesday's Fed rate cut combined with its linkage to multiple spread trading and carry trade strategies make this our obvious starting point to explain some of the markets recent mysteries. That the interests of so many investors are linked to DX, whether they know it or not, has been stated here on many occasions. That the majority of investors continue to ignore this linkage is to their detriment.
DX
Today's Bloomberg headline signals growing awareness that at least an intermediate low is likely in for DX:
Dollar Rally Bloomberg 05/01/2008. The dollar advanced to a five-week high against the euro and increased versus the Japanese, Swiss, British and other currencies a day after the Fed cut its benchmark rate by a quarter point to 2 percent and signaled that if may be finished reducing borrowing costs.
 This belated recognition of the turn comes under the heading "better late than never" but for late stage investors in precious metals and commodities, late means losses. At a time of universal loathing for the Dollar in February, as gurus proclaimed the Dollars imminent demise to 40c and fashion models made news for their decisions not to accept contracts in USD, the Danielcode alone, to my knowledge, foretold a likely floor for the Dollar at 70.40. In "Crash!" published by Financial Sense on 02/29/2008 (see my FSO archives), the Danielcode stated:
The dominant story this week for forex players has been the continued demise of the US Dollar. With DX (NYBOT Dollar Index) breaking to historic lows some months ago, this market is searching for the next level. The major Daniel monthly number sequence has picked 4 of the 5 trading levels in this market since its top in 2001 with other support levels being made at intermediate Daniel sequence numbers. The numbers suggest a continued long term decline until at least the next Daniel support at 70.40.
The market was then at 73.30 and the low was made at 70.70 on 3/17/2008. The Daniel number charts supporting this call were published in some detail in that article.
The following chart is from Members Charts at the Danielcode Online. The important support levels are found at the proprietary DC retracement ratios at 71.32 and crucially 70.97, the last level of Daniel number support. From its March 17 low, DX jumped straight to its first DC target at 77.08 (other targets not yet attained have been deleted in deference to subscribers), then retreated to test the DC support. If you were confused about DX's price action, it becomes clear when you view it on a Daniel number chart where the unexplained becomes graphic. The red DC retracement was tested on 7 separate occasions. Apparently this market knew and recognized this price level with a degree of precision that supports my claim that markets know and recognize these secret price levels that others do not see.
From those downside tests, DX rallied again to its first DC target, now at 73.12, tested it twice and broke through. Wednesday's outside bar in gray shows the market's initial reaction to the Fed announcement. Further reduction in official interest rates must weaken the Dollar, or so goes accepted wisdom from market commentators, talking heads and blogsville. What a surprise then for DX to rally entirely counter intuitively the very next day which had news services struggling to fit the news to the market action as is always the case. Markets do what markets do and commentators and news services try to find some facet of the news that will be a lucid explanation.
My assertion is the Danielcode charts alert savvy traders and investors to the price levels of high probability turns. Nothing in these charts was a surprise to DC traders. They knew the probabilities and were prepared. That is most of the battle in trading markets.

DX-v-Gold and Silver
The importance of the bottom in DX (no matter how ephemeral) had immediate and severe consequences in the gold and silver markets. Gold topped at 1033.90 basis the Comex Gold April contract. What did the Danielcode have to say about that?
I will tell you the exact price levels in gold and silver where the next "takedown" by the "conspirators" will occur. "Takedowns" in FSO 03/07/08. From "Prophesy!" in FSO 03/20/08..this is the chart posted for subscribers on the Danielcode website at 6:00PM Sunday 16th March US ET.

There were a number of Daniel sequence levels above this market at the close Friday. You can see the juxtaposition of the mid blue target at 1033.30 and the weekly target in dark blue at 1034.10. Monday's high was 1033.90 just 2 ticks from the weekly Daniel number.
Silver had a double swipe at 2 conjunctional Daniel numbers before rolling over:

Was this information from the Danielcode timely, accurate and important? Sometimes we need to put some time on immediate market events to see their significance. With gold trading today at 3 down almost 0 from its March high, and silver at .25 down over .00 and 31% from its March high, I guess most investors would say it was very important. Note that gold and silver both topped on 17 March the very day that DX bottomed.

 Should bullion owners have been aware of the risks? This from "Takedowns":
You should look closely at what happens after a blow off in these markets. That is a greater risk to you than any cartel or conspiracy whether you are a long term holder or a shorter term trader. There will be an end game and you need a strategy for that certainty which you may not have considered.
You have to know this stuff to trade fast markets. Otherwise you are a sitting duck.
Is this the end game? I doubt it, but it is certainly inflicting pain on holders of these assets.
Markets fluctuate, sometimes violently. What are your plans to protect your investment the next time this happens?
In "Hostage Gold" I told you about the inverse correlation between DX and gold/silver. DX up: Gold down! What could be clearer.
Oil
You needed to know the major turns in Oil? The Danielcode knew. FSO published this on 03/20:
Oil peaked 1 tick from its Daniel target before running to its first DC retracement.

and this last week:

Oil stopped its relentless charge at 118.98 just ticks from its next sequential Danielcode target and has spent the week having a breather. There are two degrees of DC targets at 122 and more above if that resistance gives way.
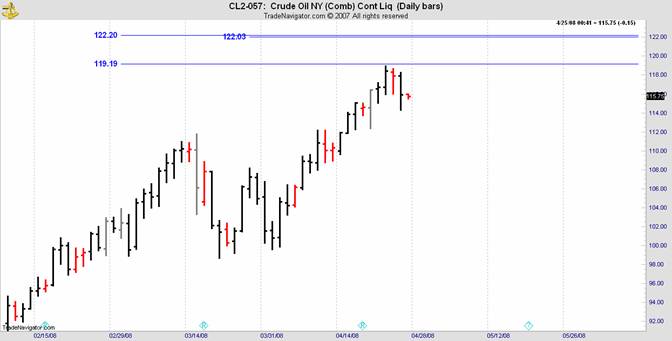
Was it important to know Oil's turn at 1. Did you know there was a high probability of a turn in Oil at 9?
Corn
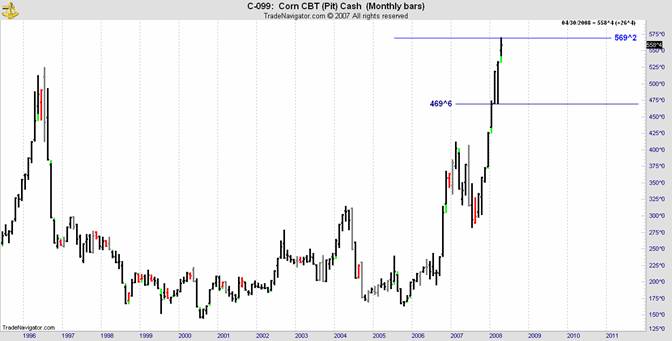
How about Corn? The Danielcode gave us 622^2 and 580^0 on the daily chart. Did you know there was a high probability of turns at these numbers? Not unless you followed the Daniel numbers

And FSO have been publishing the longer term DC Corn chart with its Daniel number sequence for months. The monthly cash contract is below:
Rice
To provide another bow to the argument here is the Rice chart updated from my FSO "Charting around Asia" articles for which I make available a number of free charts, with DC sequences at the Danielcode Online. This is the update posted for FSO readers on 28 April:

That high was 2482 against its monthly DC number at 2478. Rice is trading today at 2063 and has made a significant top just 4 ticks from its DC target. This market has clipped 419 points or almost 17% off the top tick in just 6 trading days. Did you have the DC number? It was on the free chart at the Danielcode Online for FSO readers.
Euro
What about the Euro? Did you know that the Euro had a high probability turning point at 1.6006. The high came at 1.6019 on April 22 just 13 ticks (pips) through the next DC target. Bet that was a surprise. More sitting ducks who did not have this information. Here is the members chart posted on 14 April:
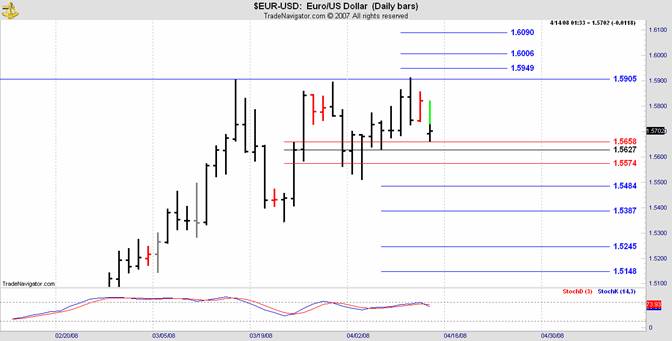
G7 talk caused the gap. 3 times at DC resistance at 1.5909. The 4th time they usually go through.
Is this sufficient evidence for the assertion. There's more. Much more. In every FSO article I point out these important turns again and again in different markets. All the turns in all the markets.
Summary
My argument is that the Danielcode defines all markets in all time frames with a unique methodology that creates significant price points that markets recognize but others do not see. The evidence for this proposition is strong, mounting and subject to constant independent verification.
The Daniel numbers are a great adjunct to the trader's tool box. They will prevent you being a sitting duck. If we think of these numbers in terms of "could this be a turning price" rather than "is this it", the evidence becomes overwhelming. Price points for high probability turns are arguably, the most important information that traders need, so that for now will suffice.
I invite you to visit the Danielcode Online to see and consider the free Daniel charts covering Australian and Asian indices and continuing to chart the fortunes of Rice and the International Market Index. This weekend for something completely new I will be working up the weekly charts of FTSE, DAX and the two major Indian indices, SENSEX and the NIFTY FIFTY, complete with their Daniel numbers. Now there's a challenge. These charts will be added to our free charts menu for FSO readers probably on Sunday and will be available for one week only so be sure to check out all the Daniel numbers at the DC website next week.
Copyright © 2008 John Needham


