


CRB Index
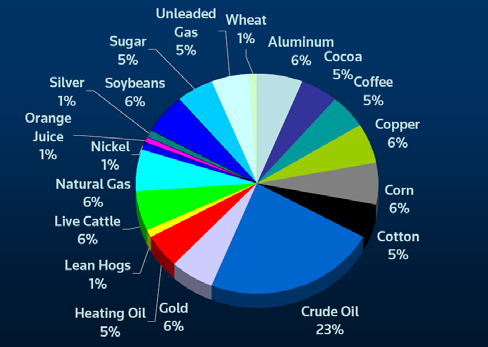
Today we will look at the CRB index, as well as updating our usual market reports. The pie graph below shows its component parts. The dominant commodity is Crude Oil with a 23% weighting followed by Corn, Copper, Aluminium, Soybeans, Natural Gas, Live Cattle and Gold, all on 6%
Here is the Long Term Trend Chart from the Danielcode:

We can get in a bit closer to see what picques our interest in the current state of play:
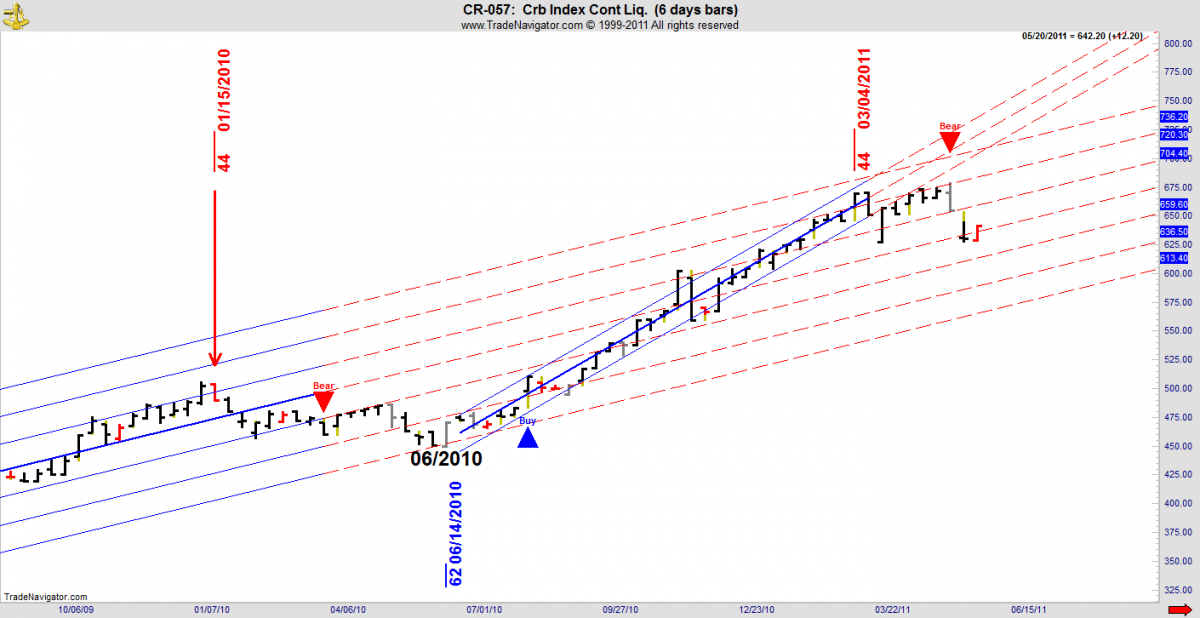
From the first chart we see that this index made its low on 12/2008 and has been on a tear ever since, punctuated by a Sell signal from the 44 DC time cycles in 01/10. That pullback fell all the way to the 3rd iteration of the DC trading channel before finding its expected support at the DC 62 week time cycle which is traditionally supportive in most markets.
From that low the CRB index commenced an almost 8 month rally into the next 44 time cycle which ended the week of 03/11 and created the momentum or closing high for this market. The following 6 weeks (note these are DC trading “weeks” comprising 6 trading days to each bar) saw this market struggle unsuccessfully to regain its DC trading channel, and now we see the first confirmed Sell signal on this time series since January 2010 being created.
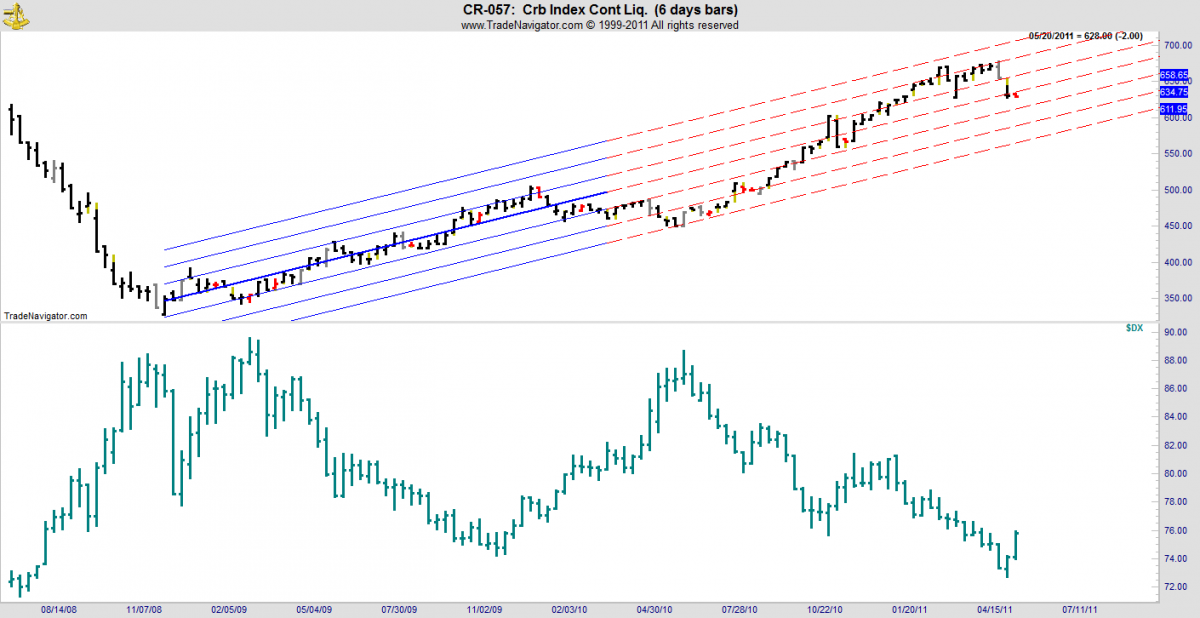
All of the markets comprising the CRB index are quoted in US Dollars, so it should be no surprise to see the inverse correlations between this market and the US Dollar Index below:
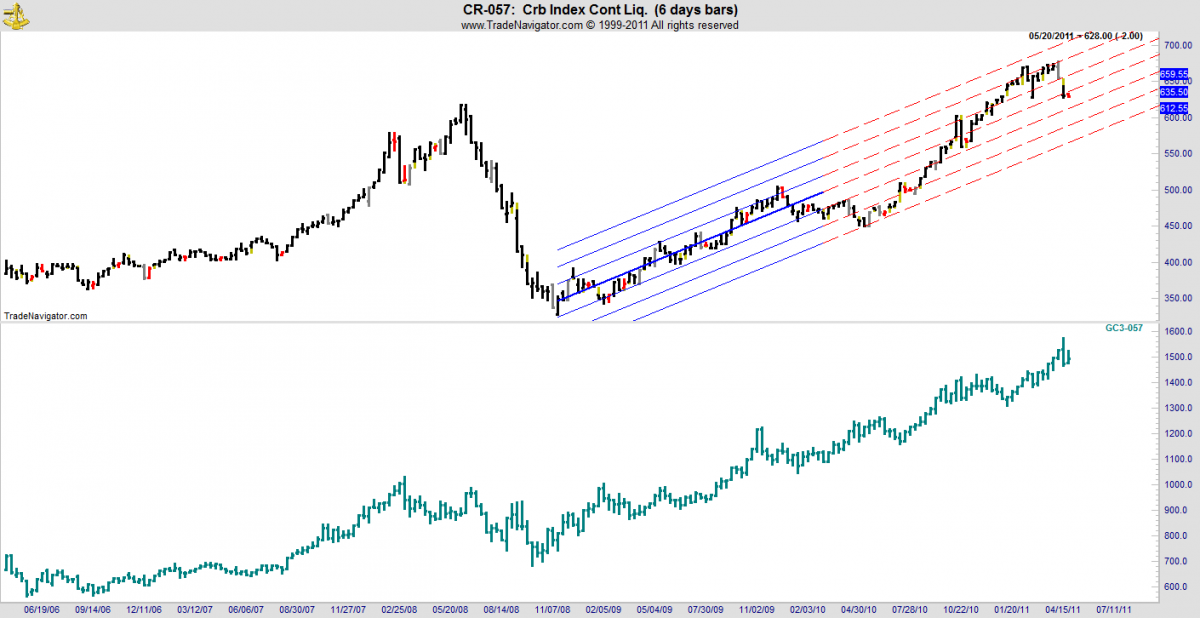
What is more interesting is to see the correlations against Gold which is in a linear correlation:
As is the S&P Index:

This was not always so. Prior to the 2000 top in Equities, the S&P ran an inverse correlation to the CRB. What we see now is that almost all markets have a high correlation either linear or inverse with DX.
Here is Gold’s relationship with DX. Not exact as it is punctuated by periods of direct as opposed to the traditional inverse correlation, but nonetheless compelling:

On the daily chart we see that Gold is trying to leave its habitual inverse relationship with DX and turn it into a linear (same direction) correlation. This is an uncomfortable fit for both of these markets.

In thinking about why markets do what they do, we can observe that the massive stimulus now approaching Trillion that US Fed has created in its quest to support asset reflation, would normally lead to lower interest rates as the world is awash with cash, all of which needs to find a home. With official interest rates already near zero consequent on the Fed and ECB’s near ZIRP policy settings, much of these surplus funds (or at least those not used by central banks to buy toxic assets) have bled into the commodities markets, creating the parabolic graph that is the CRB index. Presumably this was the Fed’s intention since this effect is well known, so you can rightly blame your friendly Central Bank Governor for the rise in food prices and other essentials for your weekly shopping basket.

Central Bankers always claim that policy tools are blunt instruments. With real interest rates in the negative zone, and the established mind set through US, UK and Europe that interest rates can never again rise in a meaningful manner, fiscal policy really does become a matter of “pushing on a string”.
Newton’s Laws determine how successful this can be, and essentially it’s a function of the diameter and tensile strength of the string. Now that we have a confirmed Sell signal in CRB, a better analogy is Needham’s Pasta Principle, which states that the success of pushing on a piece of pasta is directly correlated to the time of boiling. And indeed our financial leaders have been cooking this batch of pasta for far too long. Central Banks of Western countries have done the fiscal stimulus to death. Al dente was apparently not in any of their vocabularies. Even in countries like Australia where the Global Credit Crisis never visited, the incumbent Treasurer leapt to create massive and totally unnecessary stimulus. And now all are wondering how to get off the roller coaster.
The important Western economies, US, Europe, Japan and UK are like a bunch of druggies. They have been hit with a steady diet of coke, horse or whatever the drug du jour may be, and now like all addicts, the thought of going straight is anathema.
Regrettably for those who will undergo detox at some point in time, prescribing more debt to solve an excess debt problem is not a solution that is going to fly. At some time the spaghetti is cooked, and more cooking just makes the problem worse. Nowhere are the solutions more apparent or elusive than US. The apparent is clear. More revenue and less spending are essential. Nowhere is the desire for the edible parts of Socialism (Health care, unemployment benefits, subsidised and State sponsored housing, pensions) known to be available without you, the punters paying for it through higher taxes or heaven forbid, corporates losing their tax perks and actually paying real rates of tax on profits.
But what is apparent to anyone who has to balance a family budget is not apparent to our political masters. Republicans have locked themselves into a policy of no tax increases anywhere, ever, a good starting point for those wishing to retain office, but the death blow for those socialist aspirations to do more for the folks.


