


I will tell you the exact price levels in gold and silver where the next "takedown" by the "conspirators" will occur. The periodic takedowns of these markets are predictable to a matter of ticks and the conspirators are not who you think. But first the background.
The Conspiracy
There is an extraordinary belief, passionately held by some that the gold market is systematically manipulated by a cabal of vaporous banks, sinister financiers and the US government among others who operate as a group to suppress the price of gold and presumably silver. For some years I have been reading the periodic diatribes against the gold market being "taken down" by these sinister forces and always thought it was some long running joke that I was not privy to. It is not apparent to me why it is in anyone's interest to do this. Presumably miners want the highest value for their product, central banks that still have gold holdings want the highest value for their asset and the biggest end users of gold, jewellers, don't care. They buy at market price and sell with their mark-up. So I was intrigued to see a report on the action by GATA the Gold Anti-Trust Action Committee, in placing an ad in the Wall Street Journal, the news dated January 2008 being that WSJ had agreed to publish the ad, and the inference being that this was such a serious matter that management at WSJ would weigh publication seriously.
The ad which according to a GATA release cost about $246K made startling allegations which go to the heart of the conspiratorial belief:
The GATA ad charges that
"the U.S. government surreptitiously utilizes gold reserves to engage in international swaps and other market manipulations. The ad states that the objective of this manipulation is to conceal the mismanagement of the U.S. dollar so that it might retain its function as the world's reserve currency."
The peripheral conspiracy arguments of the government's right of confiscation of gold in national emergencies and the personal freedoms to own physical gold and silver are peculiarly US centric matters that no Aussie would buy into, other than to state the obvious that all governments have reserve powers to expropriate their citizen's assets in times of national emergency, but the issues of the systemic weakness in the US Dollar and the allegations of manipulation of the gold market are matters of concern to all market participants. There seem to be any number of arguments made on the linkage between gold, bond rates and inflation rates. Whether this linkage is true is largely irrelevant as the continued expansion of money supply by the Fed dwarfs all other arguments as a fait accompli and it is hardly a secret that government reporting of inflation statistics seriously under reports the price inflation experienced at the household level; nor is the understating of real inflation a matter peculiar to US.
As to the gist of the gold conspiracy argument, while I am sure that it is great fun to those involved, there is not a scintilla of evidence advanced to support the case. So are we expected to take these allegations seriously? With the funding expended by GATA on legal test cases and advertising, clearly a lot of people take it very seriously indeed. As gold players we need to examine some of the evidence available. I acknowledge here that in examining the gold conspiracy argument some of the lines of reasoning may include assertions outside GATA's brief but the argument advanced is to throw some light on what markets do and to highlight the real risk to gold bugs and it's not the US government!
The Dollar Rout
The US Dollar has been in decline since 1985. Historic charts in this article are from chartsrus.com. For chart buffs it is well worth a visit. The more recent weakness in the Dollar is fresh in our minds and is fertile grounds for extravagant media coverage and yes, conspiracy theories, but the chart below shows the unwinding of the Dollars buying power for the past 22 years, so if there is "mismanagement of the US Dollar" as asserted by GATA it has been going on for a long time and a number of different administrations must have been complicit.

More recently, the Dollar's second leg of its decline since 1985 has been orderly and complies perfectly with the progressions ordained by its primary and secondary Daniel sequence numbers. The monthly chart below shows the exactitude of the Daniel numbers with DX acknowledging the Daniel number support for a month in 02/03, 3 months from 06/03, 8 months from 01/04, 14 months from 12/04 and 6 months from a retest of 84.90 level from 05/06.
Because the Daniel sequence is objectively created in exactly the same way for all charts we can say that the acceleration of the Dollar's fall from 07/01 is perfectly normal, what we expect in a trending market and the precision with which it is observing its Daniel sequence only buffers the observation that this is perfectly normal market behaviour. It may not be what all sectors of the community want to see but it is the classic economic response from the world's biggest debtor nation. Devalue the currency (while asserting a strong Dollar policy for diplomacy's sake) and use the floating characteristics of modern currencies as a shock absorber. It makes perfect sense to me.
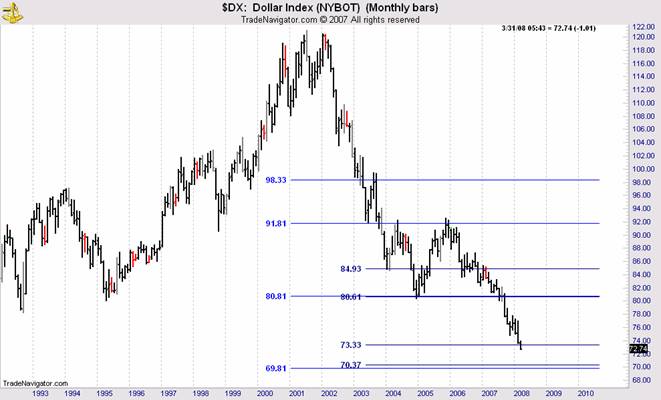
The Dollar is headed for 70c and for subscribers to the Danielcode Online there are more numbers below if that level, where there are two degrees of Daniel support from different price structures, doesn't hold.
The Takedown price levels
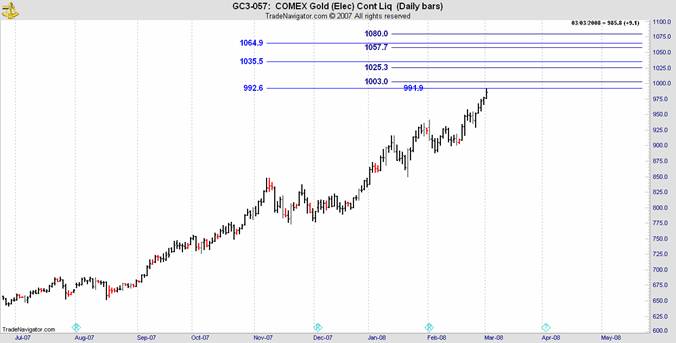
The "takedown" levels in gold and silver are the Daniel numbers relevant to those charts. It's that simple. I have been showing you how gold has made every turn this year through 11 swings on the daily chart within 1.7 points of its Daniel numbers. Most of the turns have been within a few cents. Today I have a unique opportunity to advance that argument. This week gold made a new high on Monday at 991.90, gave punters a scare on Tuesday by dropping 34 bucks, put in a turn on Wednesday at 960.70 and closed Wednesday at 991.50.
If you missed these turns or were in the wrong way you have only yourself to blame. The following chart was published by Financial Sense on its Asia page in my bi-monthly roundup "Charting around Asia" on 03/04 and was also published on the main Financial Sense University page the same day. The articles are still there now. I suggest you look and see. The Financial Sense Asia page is the 2nd tab from the right at the top of the main page. The next number for gold in its Daniel sequence, as you can see from this chart was 991.90. Monday's high was 991.90. Tuesday's high was 990.30. DC subscribers are taught always to look for 50% retracements in the daily swings particularly in this market and the Australian SPI 200. The 50% retracement was at 960.40. Tuesday's low was 958.30. Gold reversed at its DC retracement on Wednesday and closed the day at its Daniel number at 991.50. Thursday was an inside day.
The "cartel" obviously knew these market numbers. Did you? They were on subscribers weekly charts posted on Sunday so those who knew had plenty of time to prepare.
The case for the takedown numbers in Silver is even more compelling. Not often do I have the opportunity to demonstrate the precision of the Daniel numbers with real time confirmation by public publication.
This week at the request of clients I started covering Silver in the charts at the Danielcode website. Due to the enormous interest in gold and silver prices and the gyrations of the markets, I am making a new gold and silver section where weekly and daily charts of the Daniel numbers will be posted. I am considering doing 4 hour charts for these markets if there is sufficient interest which seems likely.
On Tuesday the following daily chart of Silver from the Danielcode Online was also published by Financial Sense in my Charting around Asia article with this comment:
"The following chart is Silver. There is considerable congestion in the Daniel targets at this price level and immediately above. This is a futures chart which suffers from fluctuating premium but the targets are from different price structures and the congestion is meaningful"
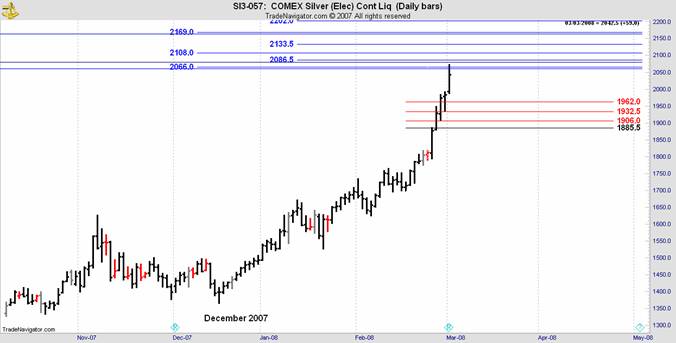
The congestion was certainly meaningful as Monday's high at 2074.0 took fright at the phalanx of Daniel numbers and promptly reversed on Tuesday. On Wednesday and Thursday silver mounted another rally to 2132.50 breaking through several layers of DC numbers only to be turned back at 2132.50 just 1 cent from the Daniel number you see sitting at 2133.50 in this chart. Thursday closed the day at 2024.0 down .00 from its Daniel turn. Did you read the article and see the chart? Others did.
If you are trading gold or silver without looking at these Daniel charts you are flying blind. The cartel again knew the Daniel numbers and plundered you accordingly. As to how the cartel knows these numbers which markets recognize but others don't know, that is revealed in my earlier articles on the Danielcode which are in my FSO archives.
All markets are manipulated!
Some by dominant players and some undoubtedly by government. Every day in the current credit crisis we see central banks manipulating credit markets by supplying repos and other facilities to banks outside their normal terms. Indeed they make up the rules as circumstances require. Scandal? No, it is part of their charter to manipulate markets. It is called price stability. No one complains when the Fed makes an unannounced interest rate cut. The market commentators (all natural bulls) applaud and bellow for more. Ask the shorts in the equity markets if an unannounced 50 point interest rate cut before the market opened on an options expiration Friday was market manipulation. Of course it was. Direct, effective and cynical market manipulation that beat the shorts when they were most vulnerable!
Short term interest rates too are manipulated every day by the Fed's stand-by facilities. The Fed adds or drains liquidity to attempt to match short rates to the discount rate. The present home mortgage drama sees Fed and State officials from the President down trying to stabilise home prices with a plan to freeze mortgage repayments and offering funding from Federal and State institutions to stop the mortgage resets that threaten to engulf the US home market. Both the intent and effect of these initiatives is to manipulate the property market by easing the price pressure that a tsunami of foreclosures would bring.
No market manipulation? Spare me.
Here’s the News guys: Markets fluctuate
This is the real risk to holders of gold and silver. Not the fictitious cartel. The market giveth and the market taketh away from the unwary. It is the market itself which is the real cartel!
Just to remind you of what these markets in particular can do, here are some interesting charts on gold. The first chart is a 600 year look at gold prices adjusted to constant1998 dollars.

The following charts are gold from 1800 -2002 showing the spike into 1979 when gold reached 0 and change. Even though the spike reduces the rest of the chart to a virtual straight line we can see periodic eruptions as gold breaks from its somnolence to have periodic eruptions of price support. We can also see and marvel at the blow off that is characteristic of many commodity markets; they build, they ignite, they go parabolic and then it is over.
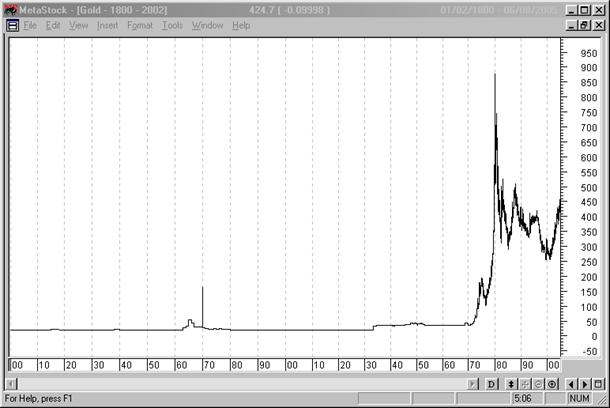
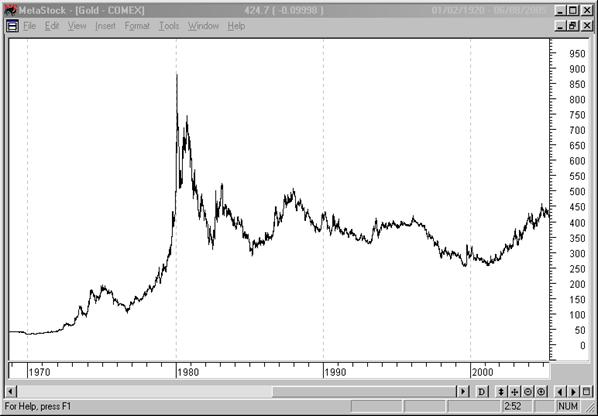
You should look closely at what happens after a blow off in these markets. That is a greater risk to you than any cartel or conspiracy whether you are a long term holder or a shorter term trader. There will be an end game and you need a strategy for that certainty which you may not have considered.
The same thing happens in silver. The next chart demonstrates the 1980 squeeze when the Hunt brothers tried to corner this market
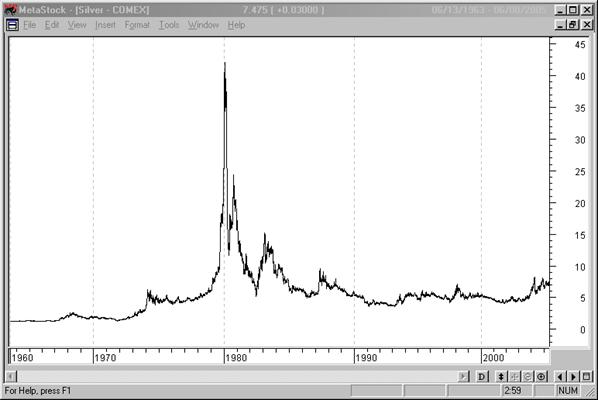
Markets fluctuate, sometimes violently. What are your plans to protect your investment the next time this happens? Oh, it won't happen? This time it's different? It wasn't so long ago we were hearing that story about the housing market and the credit problems.
Where to for Gold?
The immediate future for Gold is tied to its Daniel sequence. The weekly chart below shows what I believe is the present sequence. This market "recognised" this particular Daniel number sequence on 11/07 with its 6 week reaction to the 2 price level.

It also recognised the next Daniel price level at 7 on a close only basis one of the quirks of the Danielcode being that it can complete its number recognition on either a high/low bar or close only basis. That augurs well for this sequence to continue dominating this chart which means 27 beckons. I am cognisant of the argument that to match its 1979 peak in real dollars gold needs to go much higher. It may, and if so there are more Daniel numbers. There will also be "takedowns", otherwise know as corrections along the way. I have those numbers too.

Other Markets
To show how other markets follow the Daniel numbers, in all timeframes, here is a 60 minute chart of AUD-JPY during the week. 10 ticks from our top number and 1 tick off the bottom with recognition at the intervening numbers. Easy 600 ticks wasn't it.

Did 4 for Oil surprise you? Not us. The number has been on the chart for months. There are 3 degrees of Daniel resistance at 106-107. If that doesn't stop it there are more DC numbers above but only subscribers will know.
I trust that I have made the first leg of the case that gold and silver markets are rational, precise, organised and reasonably predictable. So far this year every turn in these markets has been at Daniel numbers calculated and posted on the Danielcode website in plenty of time to consider your trading and investing strategy. These markets act very normally. Normal markets correct constantly. These markets are positive angels compared to the S&P. Start a conspiracy theory on the S&P (we need a better yarn than the PPT) and I will be Chairman!
This is what two of my prominent Gold trading clients had to say about the Daniel numbers for gold:
Your accuracy is better than any service I have ever known. I am over 70 years old and more than 50 years in the market. Ed S. Italy
I can say that there is nothing like Danielcode that accurately predicts Gold reversals in terms of turning points...I've looked for this for years. And DC is the only thing that works. I think just combining it with regular indicators like MACD, RSI, and Stoch would help one just sit back and relax. Neil L. USA
Let me make it clear that you have to know how to trade to benefit from the amazing Danielcode numbers. Whilst we have the numbers that forecast turning points with a high degree of precision, nothing tells us in advance which numbers in the sequence will offer temporary or terminal resistance. Only observation of price action and market knowledge tells us that.
Tuition and Seminars
I conduct private tuition most months and seminars occasionally. If you seriously want to learn to trade safely and profitably I will teach you. Knowledge comes at a cost. If trading is a pastime for you, there is plenty of entertainment out there. If you want to make it a business and commit yourself come to me. It costs more than 3 months of your car lease but much less than a Law degree. I have done both and I'm not sure which was tougher but trading is a serious business. Please don't waste my time if you expect to learn a lifetime skill in 10 minutes for the cost of a packet of Corn Flakes.
If you are trading any of these markets, the "cartel" (really just the markets) will get you if you can't match their skill and knowledge. Only the Danielcode will give you these precise market numbers. I invite you to visit my website and get all the Daniel numbers for gold, silver and other markets I cover to prepare for more market adventures next week.
If you didn't have the Daniel numbers this week you weren't reading Financial Sense carefully enough. They were all there!
Copyright © 2008 John Needham


