


The Setup
Few things are more annoying to the average S&P trader than the dreaded overnight gaps which have become more prevalent since volatility in this market increased. Equally frustrating are the magical numbers that define these moves and the implication that “They” know something reserved for the big boys that is not for you. Occasionally when foreknowledge of these secret numbers is revealed, it is muttered with more than a hint that this is highly privileged information restricted to the club! Those who know are not going to let you into the secret. This is hubris extremus and as I set most of these levels for at least some of the “boys” (obviously the most talkative ones) I am happy to let my Financial Sense readers into this arcane and secretive world.
The problem arises because of the prevalence of economic news and numbers issued pre-market. This gives the French and British traders and the few round the clock US traders the chance to benchmark the market at a time of relatively low volume and not much competition. The growth of global trading houses means that the big boys in the S&P see these moves in one country or another as you are still stumbling over your second cup of coffee and the new Fed thinks it is rather cute to make unscheduled announcements pre-market to shock and punish those brave or foolish enough to short these hallowed markets. This is what they did on 22 January. Unfortunately, they missed options expiration day on this occasion which is their preferred party trick!
The Sting
Naturally the globex or after hours market reacts to news instantly while the slow coaches who start at normal market hours are left to do the best they can. What we are interested in here is how do the big boys set these price levels? Below I have placed the current S&P futures contract in the top pane and the S&P globex chart below it. Apart from the fact that these two charts of the same market made their lows on different days which is always of interest but can merely be a chart timing issue (globex switches to the next day at midnight) we are primarily concerned with the big boys low of 1255.30 made at 1:50AM US ET on the morning of Tuesday 22 January 2008 against the RTH low on the same day of 1260.50.

Here is the 5 minute chart of the events on the morning of Tuesday 22 January. No less than 11 bars between 1:50AM and 7:20 AM had a low of 1255.30. It must be a solid number.
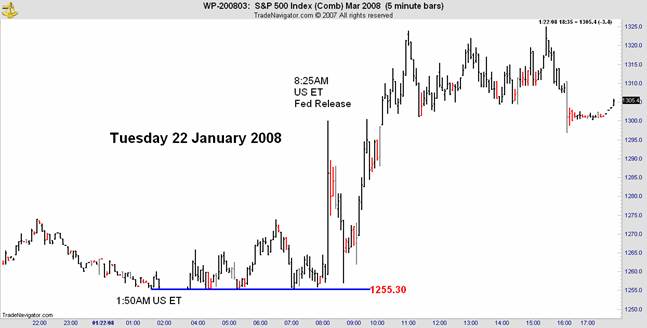
We know that the Fed announcement (at least the official version) was made at 8:25AM when the globex market in S&P futures spiked from 1259 to 1300 which is a not unreasonable reaction to a surprise 75 point cut in official interest rates. The conspiratorial take is that the globex low was in at 1:50AM, more than 6 hours before the Fed announcement and was tested 15 times between 1:50 and 8:25! Someone had a floor in this market long before they should have. At the school I went to, knowing the answers to end of year exams before the papers had been issued was considered very bad form and inevitably led to an unhappy visit to the headmasters office at a time when caning was very much in vogue!
What really happened?
Let me show you how the boys get these numbers, or at least how I get them for some of the boys. I start with a continuous globex chart and shotgun the market with every conceivable Daniel number from the dominant high, the prior high which Gann called “the high before the high” and thought important, and the high after the high which Needham thinks important. The resulting horror is shown below which if it doesn’t scare you to death at least illuminates the pressure points where we have very similar Daniel numbers from entirely different price formations.
You can see at a glance the price formations I used and the choke points where we have a number of coinciding Daniel numbers. These become my high probability target areas. For those with sharp eyes you will see the letter “R” in a diamond along the bottom of the charts. These are where the futures contracts rolled over and in this chart we are using four different contracts with four loads of fluctuating premiums to identify our target zones.
“Wait a minute”, you cry. “You can’t use different contracts to match price projections”. What about adjusting for the fluctuating premium? Conventional analysis says that you are right but in some way that I don’t yet fully understand the miracle of the Danielcode overcomes this seemingly logical problem. I am going to show you more examples of this phenomenon in our actual trading charts later on.

To emphasize the other worldly powers of the Danielcode, and at the risk of ruining your eyesight permanently, I repeated the process on the current S&P futures contracts. The chart is below. Those black dots connected by green lines in the early part of the contract are in fact just daily closing prices where there was insufficient volume to create a price bar. The Danielcode program has projected its number sequence from those closes (where only closing price was available) and from the daily highs and lows to create exactly the same target as we got from the continuous chart with multiple contracts above. Amazing stuff.

With the knowledge of the likely choke points from these linear scattergrams I can run a simple regression analysis to select the high probability Daniel number sequence. The chart below is the result.

The Daniel number projections in our target zone, made entirely from closing prices within the blue oval were 1254.50 and 1255.60. With numbers this close I simply took the mean and told my “boys” the globex number would be 1255.10. Those crafty Frenchmen couldn’t resist front running me by 2 ticks as usual, so I guess there is an innocent explanation for the numbers on the morning of January 22 after all!! Now you know how it’s done. Everything is in the charts, it’s just a matter of which charts. The next time someone mutters about the magic of black boxes or implies some special talent in finding globex numbers you can reply “I know how they do that. I read all about it on Financial Sense”.
More on Fat Tails
On Thursday I was in Wellington, the Nation’s capital to talk about the Danielcode and had the opportunity of meeting with an ex JP Morgan executive who after 23 years with that illustrious body is now happily growing grapes with his ex Goldman Sachs forex trading wife in the Wairarapa region of New Zealand! One of the questions he raised was how the Danielcode fares when confronted with an important but unexpected news event. He used the example of 911 and the Fed’s unexpected 75 point rate cut on 22 January as examples. I referred him to my previous article “Crikey! The Fed follows the Danielcode”(see my FSO archives) where we looked at the January example of stress testing the Danielcode mode and I undertook to show him how the big boys find those globex numbers with such certainty.
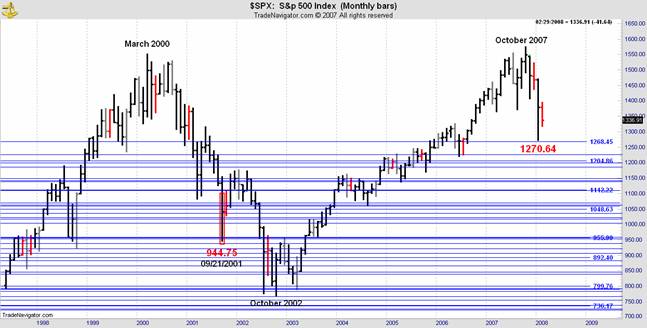
The 911 SPX weekly chart is below. It is another linear scattergram where we create every possible Daniel number from the topping structure around March 2000. We can immediately see the high probability targets where we have a concentration of Daniel numbers created from different price structures. The most prominent concentration is around the 944 low made on the Friday following the re-opening of US markets after the 911 attack. That number was so important that the market later tested it twice just before and after its final low in October 2002. You will also see how the lower area of Daniel number concentrations eventually gave us the March 2003 low after being tested several times. That low launched the record rally into 2007. From this type of chart we would then concentrate on finding the exact low of 9/21/2001 that led to the subsequent 6 month rally.

If we leave the price levels on this chart untouched but convert it to a monthly chart and light up some of the Daniel numbers as I have done next, you will see that the first DC number in the sequence that we created from the 2000 top which the market traded through comfortably in 1999 and 2000 provided the monthly low in our current chart for January 2008. That is Daniel numbers from a 2000 price structure are still controlling this market in 2007! Astounding? You bet.
With a variance from target of just over 2 points in 7 years this is spectacular stuff. Markets will recognize these numbers in normal times and in times of extreme stress. Markets know and observe these numbers; the news is ancillary.
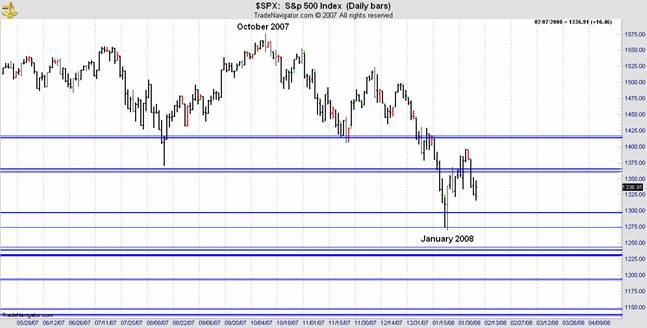
To give you a modern version of the current market’s probabilities we can re-create the linear scattergram but this time using the price structures around the 2007 high. From the chart below we see that the probabilities are against the January low being a seminal event. The odds favour a number lower down at one of our aggregated pressure points.
This week with the Danielcode
Here is another example where the Daniel numbers overcame a contract rollover. This is our Comex Gold chart. The Daniel numbers are calling every turn in this market including the gray bar below 941.80. That day was 02/01 when the Comex chart rolled from the February to the April contract with no adjustment to the chart. Every turn is within 1.5 points variance from its Daniel number. If you are a Gold bug you need these numbers.

Here is the CME contract on the Euro. Every turn is within 40 ticks of its DC number:

The DX is reading its Daniel numbers carefully and rewarding Danielcode traders appropriately:

And from last Friday to today we got the lot in the S&P with a nice turn just below our daily chart level of 1398.50 and Thursday's low of 1317.50 from our new 151minute charts. All of these numbers are posted days in advance.

The Danielcode doesn’t read the markets. Markets read the Danielcode.
Mark T from Topeka, Kansas didn’t trade any of these markets. He had other plans, and wrote to me yesterday:
On Monday the 4th, I printed off your 4 hour and Daily of the GBP and the EUR. Seeing the oscillation of the currencies off the DC numbers, I analyzed the markets with my old trading system once again and decided to short both of them versus the U.S. dollar. Entering at 1.9735 on the GBP and entering at 1.4810 on the EUR and placing my stops just 10 pips above the DC numbers, I sat back and let the markets go. Well, as you now see the GBP and the EUR are both DOWN and my stops are moved to lock in a profit of 200 pips on the GBP and I took a buy limit order of 1.4510 on the EUR this morning (U.S. time). These trades are both trading with two lots each! I made more money on just those two trades than working for three straight months! Your DC numbers are just simply unbelievable, Mr. Needham!
Copyright © 2008 John Needham


