


 In an article last month the Wall Street Journal pointed out that for the last two years commodity prices—as measured by the Dow Jones-UBS Commodity Index, as well as commodity related stocks—have substantially underperformed the S&P 500 index.
Entitled “Are Commodities Cheap?” the article points out that, historically, commodity prices and the S&P 500 have correlated very closely until October of 2011, at which time the performance of the Commodity Index and the S&P 500 began to diverge (see chart, courtesy Wall Street Journal).
The Dow-Jones UBS Commodity Index has a 37% energy sector weighting and a 36% agricultural & livestock weighting with the remainder industrial and precious metals. While the Commodity Index is composed of the actual physical commodity it also reflects investor sentiment for companies that operate in the sector. As we have noted in previous LSGI Reports both energy and agricultural stocks have been out-of-favor with investors.
We downloaded the data and calculated the coefficient of determination, also known as “R-squared”, to measure how well the movement of the S&P 500 index explains the movement of the Dow Jones UBS Commodity index. An R-squared value of 1.0 means that the two variables are perfectly correlated. An R-squared of 0.0 means that the two variables are completely independent.
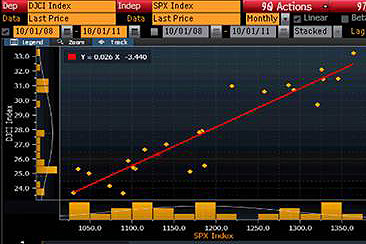 Where we have the S&P 500 index as one variable and the DJ-USB Commodity index as the other variable, historically they have tracked very closely—an incredible positive correlation of 0.932 between October 1, 2008 and October 1, 2011!
From October of 2011 to August 1, 2013 the R-squared measure has fallen to 0.409—but the correlation is -0.642, meaning that only 40.9% of the Commodity index movement is explained by the S&P index. Most interesting, the S&P index and the Commodity Index have been inversely correlated during this time frame (when one moves upward the other moves downward—the exact opposite from what is ‘normal’).
We expect the recent divergence—the lack of correlation—to reverse at some point in the near future. The fact that the S&P 500 and the DJ-UBS Commodity Index have correlated so closely for so long means that the behavior of these variables should revert to the mean—at which time we expect stocks of companies involved in the commodity sector to perform very well.
Illustrating how out-of-favor commodity stocks are, Goldman Sachs just issued their list of the “40 cheapest stocks” with the most upside potential for shareholders. Taken from a mid- and large-cap database, fully 16 of the companies—40%—are from the commodity sector! In our opinion the under-valuations and upside potential are even more attractive in the small-cap sector.


