


Despite the markets performing well retail investors across the board have dramatically increased their allocation to cash according to a new State Street study. Cash allocations have jumped in the past two years with the average rising from 26% in 2012 to 36% in 2014 in the U.S. — a huge vote of non-confidence in the equity market and possibly a reflection of an uncertain political environment, fear of another financial crisis, and the general perception that the equity markets are rigged against the individual investor (high frequency trading, insider trading, bank-rigged indexes, etc.)
This jump was equal across the age spectrum, with Millennials (under 33 years old), who are just starting their investment lives, increasing their allocations to cash at a similar rate as Baby Boomers (49-67 years old), who are starting to liquidate assets for retirement income.
Energy Sector Stocks
As investors move to cash a number of the major market indexes have been hitting new highs, but until the recent events unfolded in the Middle East most investors have ignored the energy sector in favor of biotech and technology firms.

The energy sector has come back into focus with the Iraq crisis, with the SPDR Energy Fund (XLE) performing very well over the last three months — up around 16%, outperforming the S&P 500 index by around 10% during that time period.
Small cap energy firms measured by the Powershares S&P Small Cap Energy ETF (PSCE) also performed well — up around 8%, also outperforming the S&P 500 Index and the NASDAQ Composite Index (3 month chart as of June 24th).
Outlook: Crude Oil Markets
The most recent International Energy Administration report indicates that global demand for crude oil is expected to increase from 91.4 million barrels per day in 2014’s first quarter to 94.0 million barrels per day in the last three months of the year. This will be a record level of demand at year-end. Demand in the third and fourth quarter always accelerates as the heating season for the Northern hemisphere approaches and heating fuels are produced and stockpiled.
The increase in global demand is coming in the face of a relatively tight oil market. A number of major exporting countries continue to have political problems that have impacted production and exports. Libya, Syria, Yemen, Egypt, and Nigeria all have significant production and stability issues, as well as Iraq.
 The significance of the recent unrest in Iraq is that it is one of the top five oil exporters in the world. Iraq currently exports roughly 3.3 million barrels per day (roughly 3.5% of the global market). While the southern part of the country, where the majority of the oil production occurs, has not been impacted to date the risk of interruption is certainly much higher now than six months ago (world oil demand chart courtesy Dan Steffens of the Houston-based Energy Prospectus Group).
Even if the export facilities in Iraq are not damaged Iraqi production could still be impacted if the legitimacy of the central government is called into question, with multiple players arguing they have the authority to authorize exports and receive payment for shipments.
Iraq is significant in that the IEA projected that the country would grow their production and exports faster than any other nation over the next five years. The IEA has recently trimmed its supply growth outlook due to the recent unrest. It forecasts the country will be able to produce 4.5 million barrels per day 2019, almost half a million barrels less than its previous forecast and around one-half the level Iraq was forecasting.
[Read: ISIS: Is It All About the Oil?]
Long term, IEA studies have projected that Iraq would supply 45% of the global growth in crude oil supply and exports between now and 2035, a figure that we expect will have to be re-examined in light of recent events.
Facing the increasing uncertainty and violence in Iraq several of the major oil and service companies are moving their employees to more stable locations, a process we have seen take place in Libya, Yemen, Syria, Egypt and Nigeria. The problem faced by oil exporters is that unless events stabilize it is difficult to continue sustainable operations with a remote staff.
Further, as was seen in Libya and elsewhere, the risk of damage to producing fields increases with the current unrest, with the risk that any return on incremental investments will be adversely impacted. Like any asset, producing oil and gas fields, compressors, pipelines, and processing facilities need constant maintenance and capital expenditures to insure their reliable operation.
 Year over year global demand for crude oil has been increasing at roughly 1 million barrels per day (roughly 1%), even at the ‘elevated’ price of around 0 per barrel, so any unexpected interruption of crude oil exports from Iraq would likely impact the markets.
The EIA’s latest report forecasts that global demand growth will accelerate to 1.4 million bpd next year from 1.3 million bpd in 2014.
The EIA recently noted that oil markets are “in many ways tighter today than they were at the onset of the U.S. shale and tight oil boom, and considerably tighter than they were a year ago" (price chart courtesy The Financial Times).
Liquids production from U.S. shale plays such as the Eagle Ford and Bakken are expected to increase by close to 1 million barrels per year — about the same as the increase in global demand for crude oil. If all else was equal the increase in supply would satisfy the increase in demand and oil prices probably would not be impacted much — very similar to what we have seen the last few years (note how stable oil prices have been over the last three years in the chart above). Note the potential export disruptions in Iraq will raise substantial issues with regard to global supply and pricing.
U.S. shale wells also produce a large amount of ‘condensate’ — a light, lower BTU liquid that can be used to some extent as a part of the feedstock for refiners or chemical companies. But many refineries have been designed to run on heavier oil (even the very poor quality Venezuelan crude) and cannot utilize large amounts of condensate without equipment and processes being modified. So to some extent the massive increase in ‘oil’ from the Eagle Ford and Bakken shale is not ‘traditional’ crude oil.
From an economic standpoint U.S. shale wells are a gold mine — roughly three-quarters of the ultimate reserves are recovered and sold in the first two years which makes the discounted cash flow models much more attractive than wells that might take a decade to recover a majority of their reserves.
The return on capital is very high, but on the flip side with costs of per barrel for developing the shale resource any weakness in oil pricing would quickly be reflected in lower production volumes. The other positive aspect of the steep decline curve is that wells have to continually be drilled to maintain production rates, a very positive stimulant for the U.S. and local economies.
Outlook: Natural Gas Markets
Unlike crude oil markets the natural gas markets in North America are somewhat localized. Natural gas can be exported from North America, but due to the lack of export facilities the ability to export in volume does not exist. Construction of a liquefied natural gas facility takes at least a half-dozen years and billions in capital before the first shipment is made — and returns are subject to delays and longer term price fluctuations for natural gas.
Due to the extremely cold weather in North America last winter we had record draws from natural gas storage facilities in both the U.S. and Canada. These facilities are now being replenished for next winter, with fills to continue until around mid-November.
[Read Also: U.S. Oil Dependence Moves From OPEC to Canada]
Even with a record injection season, the natural gas storage facilities are expected to start the heating season well short of the average inventory that we have seen the last five years — in fact will be the lowest we have seen in a decade. Meanwhile, the demand for natural gas has increased substantially over the last decade, so the question of sufficiency of supplies for next heating season is one that will be answered in real time.
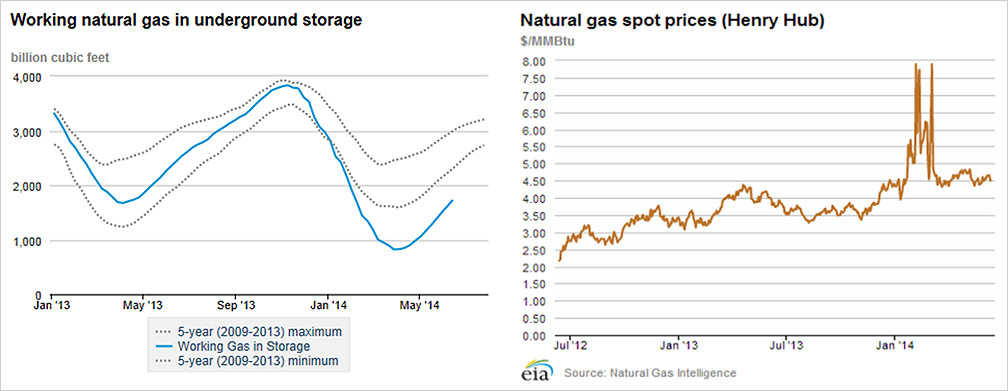
In light of the demand from storage facilities and the ongoing economic expansion, the price of natural gas has been trending upward (chart courtesy Energy Information Administration).
As we enter the summer months many electric utilities utilize gas-powered generators to supplement their coal plants, and injection rates into storage generally decreases as natural gas capacity is allocated to generation. This summer to date we have not seen a major heat wave and the accompanying spike in natural gas fired generation.
Natural gas storage levels, even with the robust injections we have seen so far this year, are still well below the 5-year average for this time of year (chart courtesy Energy Information Administration).
While producers have been drilling some massive new natural gas wells in the Marcellus and Utica shales the ability to get this production online faces delays due to pipeline and gathering systems issues. In some cases the producer is required to remove the liquids and other impurities before the gas enters the transportation and distribution system, and these processing facilities might have to be constructed before production commences.
Injection activities and natural gas demand to date indicate that natural gas prices probably should continue to firm as natural gas is bid into storage, however as the Marcellus and Utica shale field pipeline system is built any ‘excess’ bullishness in the price should be moderated. None-the-less the pricing trend is expected to be upward for the remainder of the year.
Investing in the Energy Sector
Several interesting observations can be made with regard to investing in the energy sector. First, returns on capital invested by the largest companies in the oil and gas exploration and production sector have been disappointing.
The IEA issued a report noting that capital expenditures by major exploration and production firms increased from 0 billion in 2000 to 0 billion in 2012, yet production and reserve gains were extremely disappointing. The Wall Street Journal discussed the IEA findings and included the following chart which graphically illustrates the trend.

A number of analysts noted that after 2005 the historical linkage between capital expenditure and reserves/production appears to have failed — and exponential increases in capital are not resulting in the same exploration results as seen earlier.
Second, it is interesting to note that crude oil production, not including condensate, probably peaked in 2005 according to some energy experts (the increasing amounts of production are to a large extent driven by condensate production and natural gas liquids).
Third, as noted above the return on investment for an unconventional oil well drilled into shale in the U.S. can be extremely high due to the high initial recoveries and the fact most of the cash flow is captured in the first year or two of the well’s life.
In this environment, while very large firms have difficulty increasing production and reserves — and are subject to the uncertainties and risks of investing in an Iraq or Libya or Venezuela, smaller firms that focus on domestic or North American production have seen much faster growth — many times explosive growth in both production and reserves.
These smaller portfolio firms are subject to SEC requirements that they have their reserves evaluated once a year by a third party registered professional engineer. These engineers classify the reserves as proved (90% chance of recovery), probable (50% chance of recovery — the ‘most likely’ case), and ‘possible’ (10% chance of recovery).
[Hear: Dan Steffens: The Best Income Opportunities Are in the Energy Patch]
The third party engineer also determines the discounted present value of the reserves after deducting drilling, completion, operational, and plugging costs using a ten percent discount rate (the valuation is known as ‘PV10’). From the report an investor can get a good feel for the value of the assets per share, the growth of reserves over time, and if the stock is selling at a discount to the value of their assets (a ‘margin of safety’ referred to by Warren Buffett and Charlie Munger).
Pipeline Opportunities Conference: Quant Portfolio
The Houston Pipeline Opportunities Conference invited a panel of energy experts from Southern Methodist University to present our 2014 outlook on natural gas and crude oil prices and equities three months ago. We were asked to participate and were able to present a paper on our energy sector outlook.
With the problems larger companies have had increasing production, we suggested that investors might want to focus on the mid-size exploration and smaller producers, pipelines, gathering and processing firms, as well as service companies who might benefit from the explosive growth of capital expenditures.
We also presented a ‘quant’ energy portfolio we derived from an energy stock database. Using criteria that has historically been present in stocks that have outperformed the market, we identified companies that would be more likely to perform well in the coming months. The result of our research, and the returns today (three months later), can be seen in the table below.

Note that the portfolio we presented at the Pipeline Opportunity Conference performed in line with the XLE SPDR Energy ETF. Both the ETF and our quantitatively defined portfolio outperformed the market as measured by the S&P 500 index.
Active vs. Passive Portfolio Management
One of the main points in the recent bestseller ‘Capital in the Twenty-First Century’ by Thomas Piketty is that in a slow growth economy the return on capital will be higher than the return on income. Over time wealth created from capital assets compounds, creating questions relating to the fairness of wealth distribution and social inequality which he addresses.
Very few individuals are aware of the exponential power of compounding, and the worth of excess returns, to the long term investor — Piketty’s book does a great job illustrating the point that over the long term excess capital returns can generate enormous amounts of wealth.
While investors have been taking money out of the market and moving assets into cash the last few years according to the State Street study mentioned above, those who invest in the market to a large extent are choosing exchange traded tracking funds instead of individual stocks. An ongoing debate exists among academics and professionals as to whether tracking exchange traded funds are preferable to actively managed portfolios where individual stocks are selected for the portfolio.
Using factors identified in William O’Shaughnessy’s book ‘What Works on Wall Street’ and similar studies, as a teaching exercise at SMU we have assembled portfolios of publicly traded energy companies that in theory have a higher probability of outperforming the market than the average stock including the Pipeline Opportuntiy Conference quant portfolio set out above.
The relative returns from these quantitatively defined portfolios over the last several years has been similar to the portfolio above, with the caveat that these are hypothetical portfolios in a market that has been volatile and we have not taken into account tax implications (if any).
Several well regarded exchange traded funds exist to track the energy sector, including the SPDR Energy Fund (XLE), S&P Small Cap Energy ETF (PSCE), iShares Global Energy ETF (IXC), and others. Other well regarded exchange traded funds exist to track the S&P 500 and NASDAQ Composite Indexes. ETF’s also exist to track the price of natural gas and crude oil (but some academic work indicates that some of these offerings have issues relating to ‘tracking error’).
To answer the active versus passive management debate, or at least address it with an academic study, and to determine if an actual real money portfolio which would be subject to trading fees, liquidity issues, and quirks of the market (high frequency traders, etc.) we have set up a real money portfolio that will be populated with the quantitative individual company stock selections as determined by our model on June 30th. We will invest equally in each position on July 1st and track the results going forward.
Unfortunately we expect it will require years of data points before we determine with statistical significance if the quantitatively assembled portfolio is delivering excess returns. On the other hand it should be apparent relatively quickly if the actively managed real money portfolio is delivering returns similar to that of the energy tracking exchange traded funds, excess returns, or trailing these offerings.
Summary
The outlook for natural gas and crude oil prices remain favorable due to supply and demand issues for both commodities. In this environment oil and gas producers, pipelines, energy service companies, refiners, and parties involved in the transportation of energy products should continue to perform well economically, which should support their stock prices.
Investors with limited time or resources to research the energy sector, or who want to diversify across firms in the energy sector, could be well served by investing in energy sector tracking exchange traded funds. Investors who are less risk adverse, and willing to accept the risk of owning individual stocks in exchange for higher potential returns, might be served by assembling a portfolio of individual energy sector stocks.
The question of whether passive index tracking strategies, or active portfolio management, is the ‘best’ strategy depends on the investor’s goals — and the academic debate continues as to whether active portfolio managers can outperform the tracking indexes after costs and fees.


