


It’s usually constructive to go over the landscape of the market and get a feel for where things are at. Since the end of April we’ve seen the market undergo a definitive change of character. Instead of seeing most of the market in one big rally mode that we’ve become used to since September 2010, we’re seeing corrections, non-confirmations, and trend changes across different parts of the market.
1. U.S. Dollar has gone from a falling market to a rising market
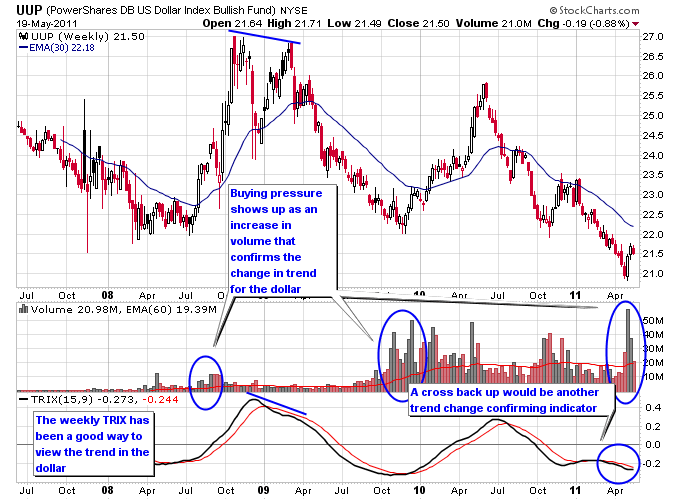
Probably the most important change has been the V-bounce in the dollar over the past three weeks and counting. Back in late April it looked like the dollar was about to fall off a cliff as Bernanke was making his televised speech. With the benefit of hindsight we can see that there was enough pessimism in the dollar at that time for it to find at least a short term bottom. The chart below is a weekly chart of UUP, which is a widely followed ETF that tracks the dollar. A couple of things are noteworthy on this chart. First notice how the dollar for the most has tended to trend over the past 3 years, there hasn’t been much sideways grinding action. The countertrend rallies in the dollar have been explosive, while the primary trend down has been a slower moving affair. Notice the big increases in volume on UUP when the dollar has staged countertrend rallies. This increase in volume confirms the change in trend. The TRIX has been a good trending indicator for the dollar, it crossed over to the downside in 2008 and didn’t look back even though the dollar tried to make a higher high in early 2009. The TRIX has rolled over since the spike top in the dollar in 2010 during the Euro crisis and hasn’t made a clean break to the upside since. If this dollar rally has staying power we should see the TRIX move back to the upside.
2. The leadership sectors have been taken out
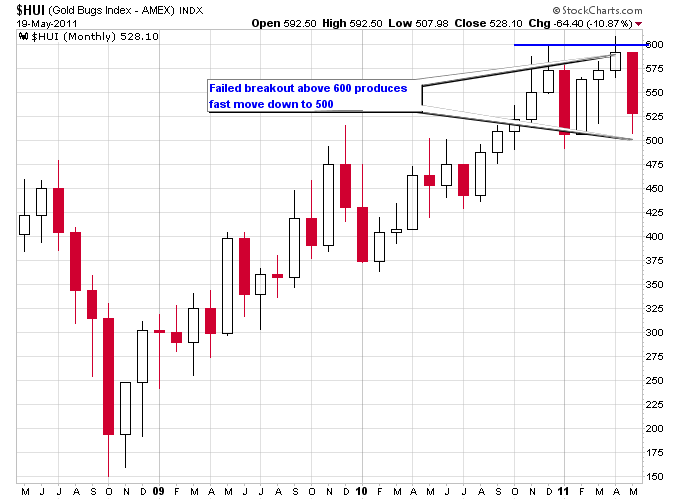
Silver was the market leader heading into the end of April but its parabolic move came to an end at the start of this month. Gold has pulled back along with silver, and mining stocks have also been hit hard. Quint Tatro likes to say that “from failed moves come fast moves” and that is exactly what happened to the mining stocks over the past two months. A failed breakout above 600 on the HUI Gold Mining Index has produced a fast move down to the 500 level.
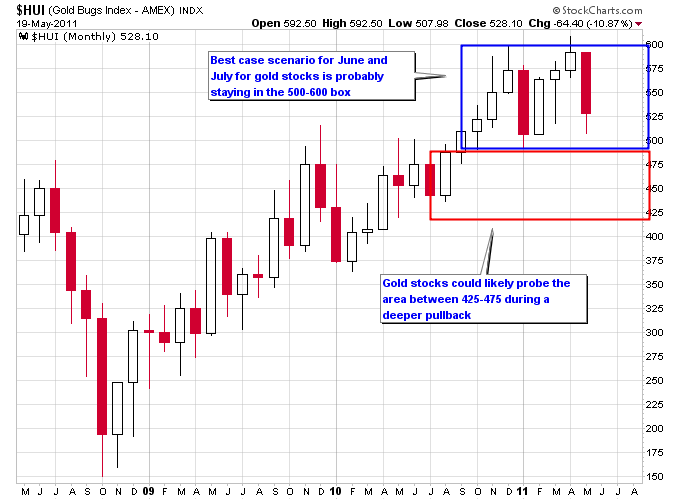
If you go back and look at how gold stocks have traded during June and July over the past decade you’ll see that for the most part those two months have resided in range bound periods, where the miners aren’t really going anywhere. You’ll also see a lot of tails on monthly candlesticks, which means at some point during the month prices dipped lower but recovered by the end of the month. This “tail risk” makes it hard to own mining stocks during this period as the volatility often shakes people out. Due to the range bound nature of the coming months, at best gold stocks are still probably going to be locked in the same trading range they’ve been in, but don’t count out dips below the current trading range.
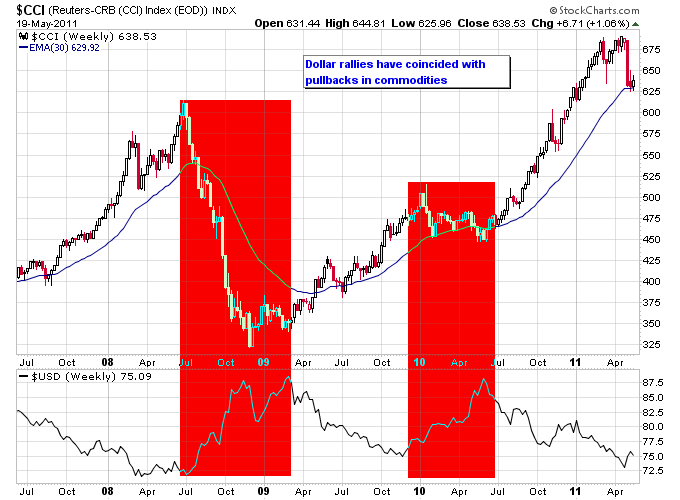
Not only have precious metals suffered intense damage but the commodity sector as a whole, which was basically leading the market since last September, has taken a hit. The two major dollar rallies over the past 3 years produced the only two big corrections in commodities. So at best if this rally in the dollar continues we should expect commodities to be range bound if they follow past precedent.
With commodities not likely to lead the market higher anytime soon the market is going to need to find new leaders if it wants to continue moving higher.
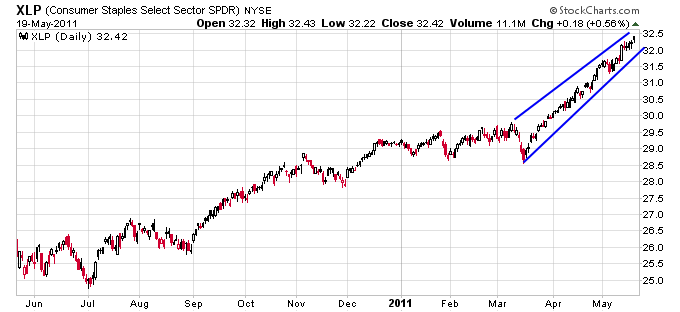
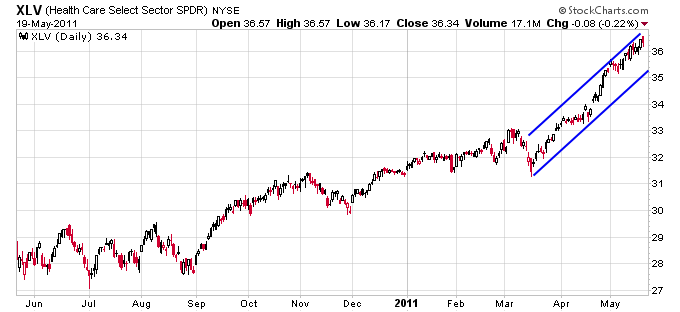
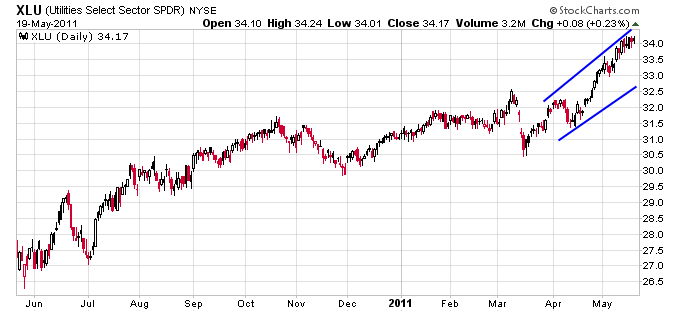
3. Defensive sectors are stretched
Speaking of new leaders the defensive sectors in the market, Consumer Staples, Healthcare, and Utilities have been on a tear lately. This is actually not a good sign though according to the Sector Rotation Model. Money tends to rotate into defensive sectors when it anticipates a pullback in the markets.
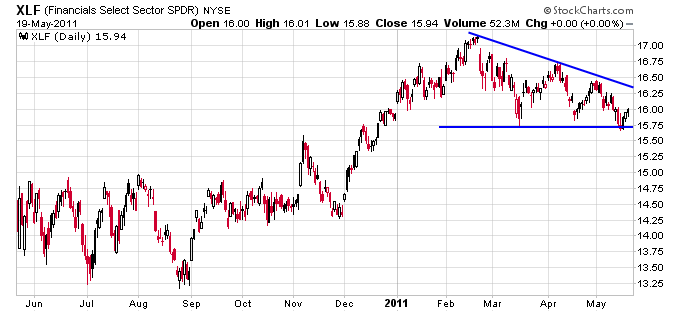
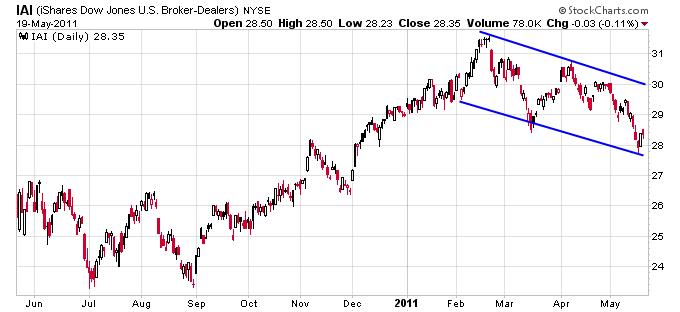
4. Financial sector is reeling
The financial sector has trended lower this year despite most of the rest of the market rallying. As is usually the case its hard for the market to sustain a long term rally without participation from the financial sector, so this divergence is noteworthy.
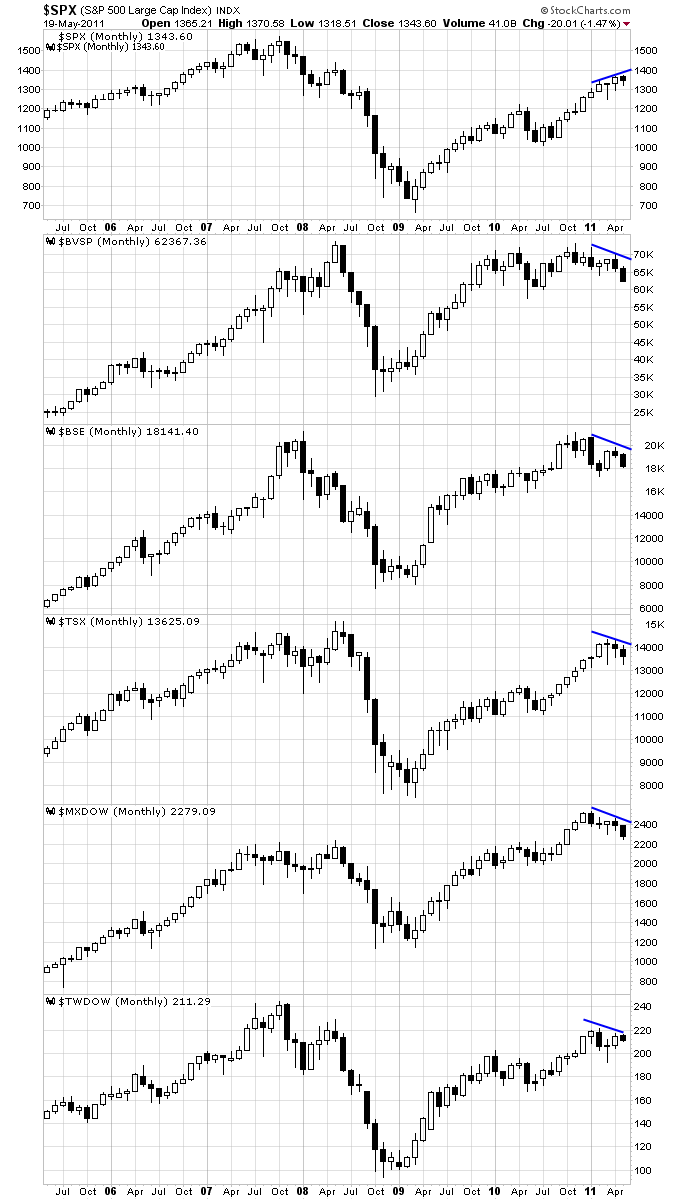
6. International markets have failed to make new highs
Some of the best performing international markets have formed a lower high recently as U.S. markets made a higher high. At a minimum this could be a warning that a more significant correction is in store for U.S. markets, but it could be worse if the international markets continue to rollover and breakdown.
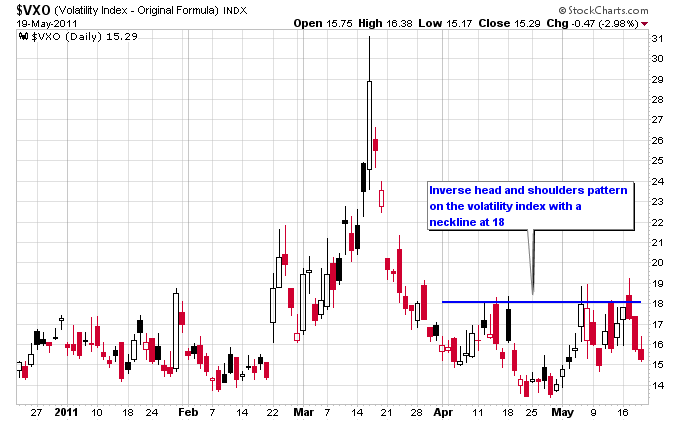
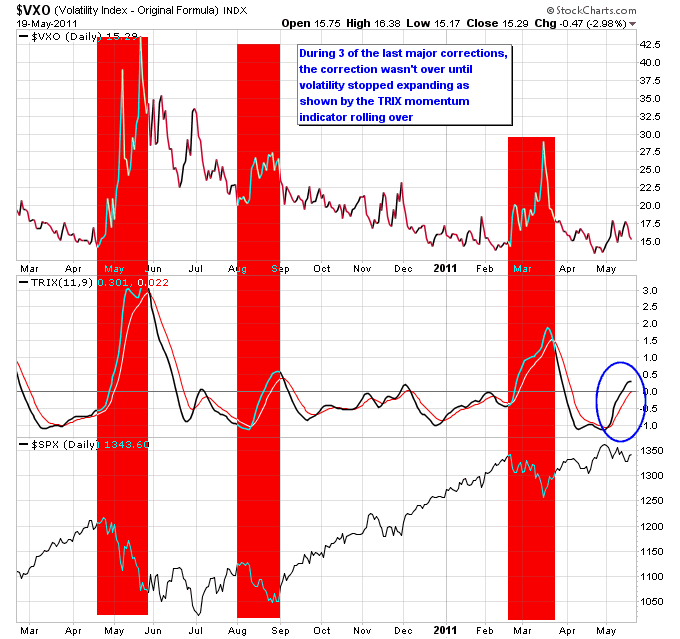
6. Volatility is starting to perk up
The Volatility Index is starting to move up after making a multi-year low in April. And zooming in on the index shows a inverse head and shoulders pattern that measures to around 22 if it were to play out.
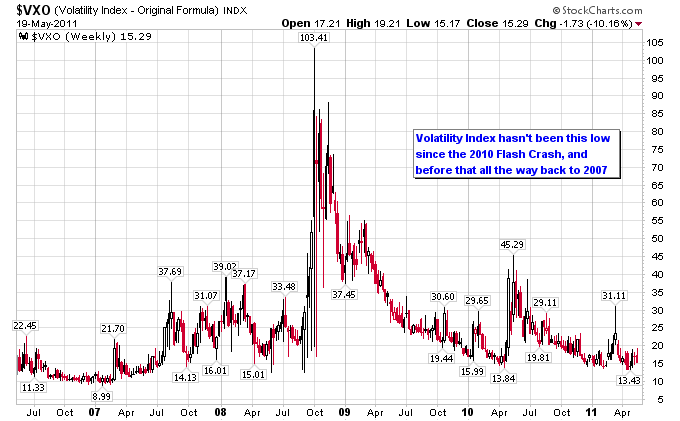
Notice how the momentum on the TRIX indicator has crossed back above zero which has only happened a few times in recent history. During big pullbacks the momentum in volatility tends to keep building until enough panic produces a bottom in the markets.
As a whole if I were making a weather forecast on the current market environment a good characterization would be “partly cloudy with a chance of rain”, or to give it more of a market characterization I’d call it “partly falling with a chance of pain”. We’re either seeing some deterioration that has the potential to turn into something worse, or just a murky environment that will clear up with some healing in sectors that have had recent pullbacks. Two things I’m keeping an eye on are the dollar and the volatility index. We’ve seen impulsive moves higher in the dollar coincide with deep market pullbacks in the past. And a break higher in the volatility index usually signals a storm on the horizon for the markets.
Source: NextBigTrade.com


