


Last November, the University of Michigan and Reuters stopped allowing third parties to update their Michigan Sentiment Index Charts. Maybe that’s because they didn’t want you to see how deep in the toilet we really are. Reuters is now apparently paying the University to keep the charts secret, just like Bloomberg paid off ABC News to buy and keep their Consumer Comfort long term historical data out of the pubic eye.
So, how deep is the ocean; how high is the sky? Let’s see what we can find.
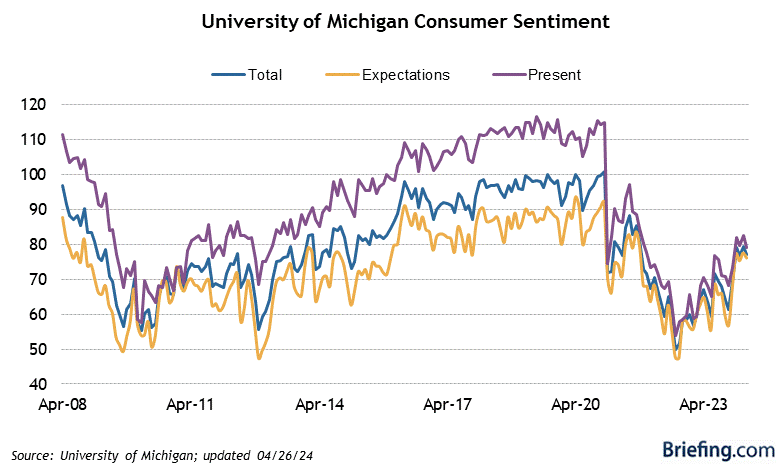
Aha! I guess the folks at Briefing.com never got the memo. Check out this chart. Interesting that expectations have broken down to a new low. That component usually leads the Michigan index.
In addition to UMich’s effrontery, ABC News sold its consumer comfort survey to Bloomberg this month. Bloomberg is only showing the last 5 years of data. But I’ve posted the historical chart so you can see how bad things are in perspective.
If you are confused by the up and down media reports, it’s not you. Your confusion is due to the way the captive media reports this data. Confidence has never been high over the past few years. It has recently been higher than in the past year, but historically it is still near rock bottom levels.
This is a diffusion index on a scale of +100 to -100. Zero is neutral.

https://www.bloomberg…FCOMF:IND#chart
That’s the last 5 years. Below is the historical perspective. The chart above is the zoomed view of the last one inch at the right of the lower chart, not including the last 3 weeks. It bears repeating that anything under 0 is a negative view.
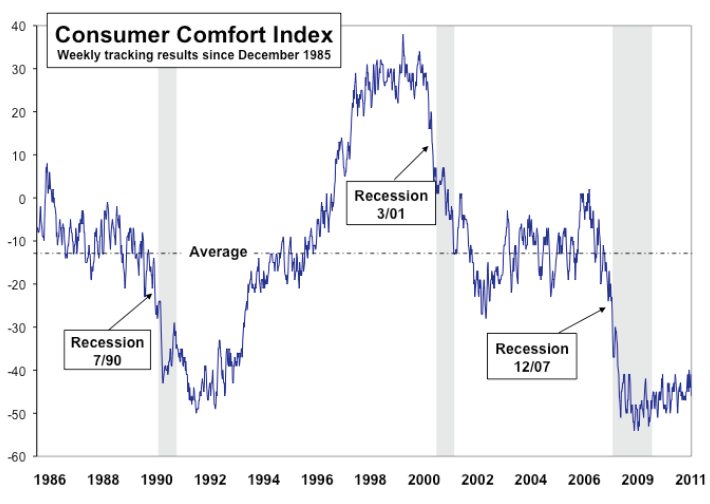
Source: ABC News and https://www.langerresearch.com/uploads/m020611.pdf
Furthermore, this survey has several components. One is how people rate the economy. That was at -76.8 last week.
No doubt, now that I have publicized this, ABC will pull all the historic data from its website and Bloomberg will send a takedown notice and threaten to sue.
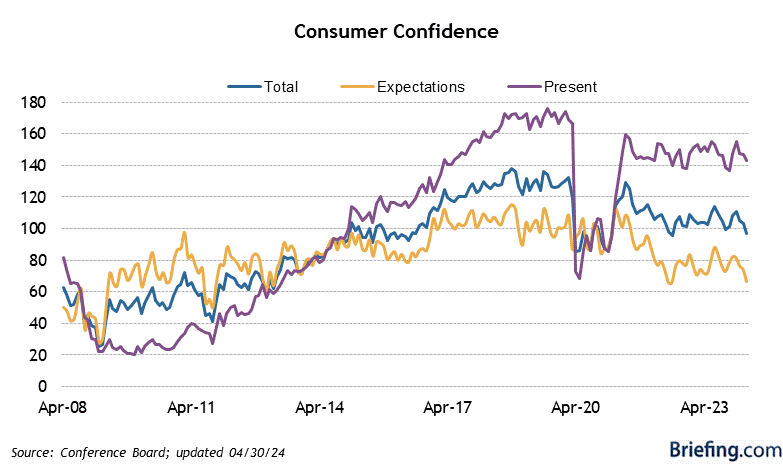
Briefing.com also tracks the Conference Board’s Consumer Confidence Index, aka, the Con Con. It apparently weights the expectations component more heavily than present situation. When it comes to expectations, consumers evidently believe the stock market. But they know their present situation and that line doesn’t lie. When this index comes out on March 29, watch it drop like a stone, especially if the stock market doesn’t bounce.
https://briefing.com/Investor/Public/Calendars/EconomicCalendar.htm
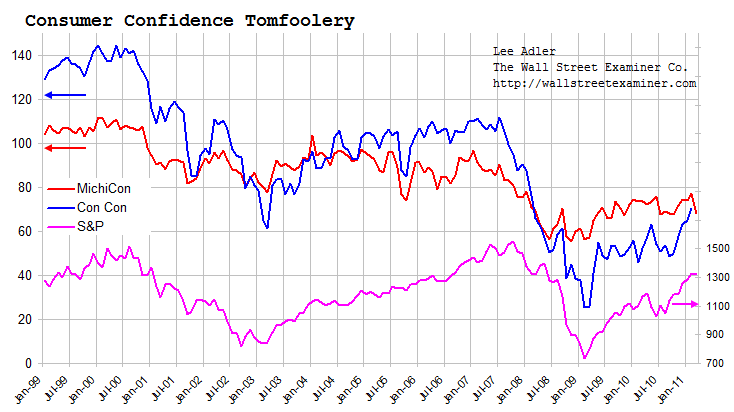
You guys know how much I love comparative data. So I couldn’t resist. I plugged in the current number for the Michigan Sentiment in the chart below and, voila! Now the question is, “Whom do you believe, investors, or real people?” It’s pretty clear that consumers didn’t believe the 2007 economic boom, and it’s even more clear that they hate the current “recovery” story.
My money is on them.
This article is a PG rated version of the R-rated original.
Stay up to date with the machinations of the Fed, Treasury, Primary Dealers and foreign central banks in the US market, along with regular updates of the US housing market, in the Fed Report in the Professional Edition, Money Liquidity, and Real Estate Package. Try it risk free for 30 days. Don’t miss another day. Get the research and analysis you need to understand these critical forces. Be prepared. Stay ahead of the herd. Click this link and get in RIGHT NOW!


