


It’s no secret that junk bonds have tumbled this year, adding to the list of worries on investors’ minds. But why are investors so concerned about high-yield bonds? And what exactly is this segment of the market telling us?
The high-yield portion of the credit market includes those companies that do not qualify for “investment-grade” ratings by one of the three major credit rating agencies. Their sub-optimal financial conditions require them to pay higher interest rates to attract capital. Oftentimes the success or failure of these companies is dependent upon evolving economic conditions.
High-yield bonds are unique in that unlike typical bonds, they tend to be higher than stocks on the risk scale. When investors become skittish, they often cut junk bonds from their portfolios first, before taking the knife to stocks.
Podcast Interview: Felix Zulauf: How to Prepare for Major Moves in Gold, Commodities, and Stocks in 2016
As a result, junk bonds are one the most sensitive segments of the credit market to changes in the economic outlook. The commotion usually begins here before spreading outward.
A quick look at JNK, the SPDR Barclays High Yield Bond ETF, highlights the sharp selloff during the last six months.
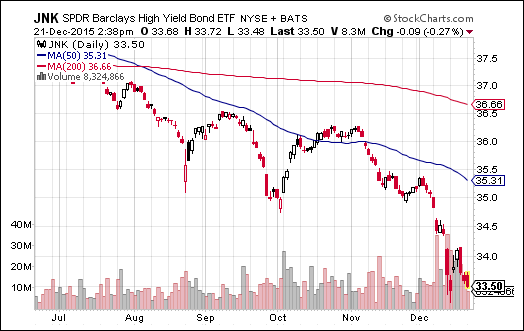
At the heart of this move is one simple fact: investors are demanding higher compensation for the risk they are taking in loaning money to struggling firms. This reflects an anticipation of deteriorating economic conditions and increased delinquencies and defaults.
The prices and yields of junk debt tends to vary over time as borrowing costs fluctuate. This makes it somewhat unfair to compare these values to each other over time. A better way of revealing changes in investor preferences is to look at the spread between high yield debt and Treasury securities. This allows us to see the relative amount of risk being priced into the group.
You may also like: Dr. Alan Beaulieu: US Economy to Skirt Recession Until 2019, Hit a Brick Wall in 2030
As it turns out, so called credit spreads are a widely adopted metric for forecasting economic recessions and periods of poor stock market performance.
A paper in the Oxford Review of Economic Policy demonstrated that, “the high-yield spread outperforms other leading financial indicators, including the term spread, the paper-bill spread, and the Federal Funds rate." Similar findings have been echoed by the International Monetary Fund and others.
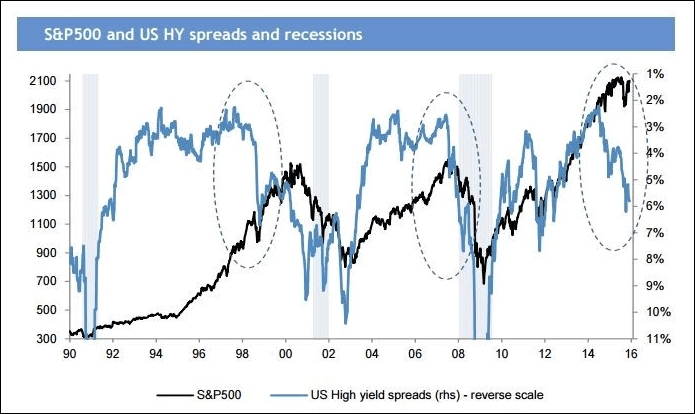
J.P. Morgan recently stated that credit spreads, the shape of the yield curve, and profit margins are the three best leading indicators for recessions. They use the chart below as evidence that widening credit spreads are harbingers of recessions (credit spread scale is reversed).
While the chart above makes a good case that junk bond spreads are a leading indicator, the reversed scale of the chart makes it a little confusing to see what’s going on. The chart below shows the high yield spread by itself, using a regular scale.
As you can see, the spread between high yield bonds and Treasuries widened ahead of the last two recessions, and it’s been widening now since June of 2014.

This should make you wonder what else happened in June of 2014. We don’t have to look far for the answer to that. June of last year is when the rout in energy and commodities began.
In the top panel of the chart below we have oil, as measured by WTIC, and in the middle panel we have the entire commodities complex, measured by the CRB index. Both of these began plummeting in June of last year (blue vertical line) right when, you guessed it, the dollar took off (bottom panel).

None of this should come as a surprise, but it does highlight the interconnected nature of many of the big picture themes we have been dealing with over the past year and a half.
Ultimately, the meteoric rise of the dollar paved the way for drastically lower commodity prices which have been killing energy, material and mining companies. Now that these moves have been sustained and are showing few signs of reversing, debt holders of those companies are becoming squeamish and spreads are on the rise.
Related interview: Credit Markets Issue Cautionary Stance on Markets
At this point the real question is if and when defaults are going to rise, and how much contagion that could cause. The contagion question is very difficult to answer and will depend heavily on the amount of damage inflicted to struggling firms.
As for defaults, they are already rising. The chart below from Standard and Poor’s shows global default rates edging higher in 2015 and exceeding 2008 levels … not necessarily a good sign.

Moody’s Investor Service tracks a 12-month global speculative-grade default rate which finished at 2.9% in November. They note that, “over a third of corporate defaults have been from commodity sectors so far this year, with the majority from oil and gas.”
They also track a US speculative-grade default rate, which hit 3.0% in November. Current estimates are for this default rate to hit 3.7% by November, 2016. Interestingly, these figures are both below the historical average of 4.2%.
So where does that leave us?
As you can see from the charts above, much of the pain in the high yield market has its roots in the price of commodities. While substantial damage has been inflicted and default rates are rising, we are not yet past the point of no return. The health of the high-yield bond market is going to depend heavily on the price of commodities moving forward, which will be a reflection of supply/demand dynamics as well as the strength of the dollar. Put simply, the continuation of lower commodity prices will exacerbate deteriorating conditions while higher commodity prices would provide some relief.
The preceding content was an excerpt from Dow Theory Letters. To receive their daily updates and research, click here to subscribe.


