


Five consecutive weeks of gains makes it hard to argue that we’re in a bear market. While it may not seem like much has changed since the markets last swooned, a few key developments remain supportive of stock prices.
In particular, a shifted stance on monetary policy, change in the trajectory of the dollar, and recovery in oil prices have turned sellers into buyers.
The Fed
Last Wednesday the Federal Reserve confirmed what many had anticipated going into the latest FOMC meeting: that the Fed would have to back off of its four-rate-hike plan for 2016.
For some time now, the Fed’s projections for monetary policy have differed significantly from that of the markets. The Fed has consistently anticipated stronger growth and a steeper path for the federal funds rate than what the market has collectively forecast.
This led to a state of cognitive dissonance among market participants, which appears to be abating now that the Fed has lowered its projections to being more in line with the market … and reality.
The dovish Fed that equity markets have come to love in recent years hasn’t completely disappeared. On top of that, the latest commentary suggests that the Fed is willing to err on the side of letting inflation run hot, meaning we could see lower rates for longer.
Consider Russell Napier Forecasts Negative Rates in the US as Deflationary Pressures Spread
Interestingly, this rhetoric is reminiscent of language used back in 2012 in which the Fed alluded to being just fine with inflation running a half percentage point above target.
As discussed last week, the answer to copious amounts of debt is inflation. “Accidentally” running above their inflation target wouldn’t necessarily be a bad idea.
Note: For those of you who disagree with that last statement because inflation eats away at the savings of the American people, consider that higher inflation would force interest rates higher, allowing savers to obtain higher returns.
The Dollar
In response to many developments, including the shifting stance on monetary policy, the dollar has entered a short-term downward trend, marked by lower highs and lower lows.
This chart shows the recent action of the dollar, which is easing pressure on oil and commodities, dollar-denominated foreign debt, weak US exports, and multinational corporate profits. While these benefits typically accrue at the cost of other nations, it’s a nice temporary relief from what has otherwise been a huge thorn in the side of the US economy.
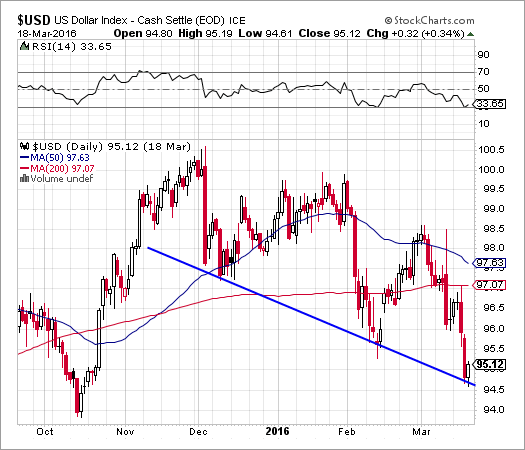
But before you get too excited, recognize the larger context in which this is playing out. The dollar may be in a temporary decline, but it remains well inside the trading range that began early last year.

This price action could be viewed as a flag or pennant formation, which often results in a breakout in the direction of the previous trend (stronger dollar).
At any rate, enjoy the reprieve while it lasts.
Oil
Oil has been the key to this market for some time, and I would venture to say that nothing has changed. This chart shows the strong correlation between oil (candlesticks) and the S&P 500 (black line).

After bottoming together in mid-February, sharply higher oil prices have taken overall equity prices with them. The problem is that the rise in oil may not be sustainable, as it has been driven by rumors and hopes of production cuts rather than shifting fundamentals.
Oil producing countries are planning to meet in April to further discuss plans of an output freeze. If nothing material comes from this meeting, it seems likely that oil prices could take another leg lower, in which case stocks will probably follow suit.
In the meantime, higher oil prices are reducing default risks across the globe and boosting earnings estimates moving forward. This explains much of the positive action we’ve seen in the stock market lately.
Moving Forward
The rally off of February lows has been a one-way affair. This indicates that momentum is playing a large role in keeping these markets heading higher.
Further clues of how market sentiment has shifted will come during the next pullback when we see how supportive buyers remain during a period of falling prices. If the February lows are not breached, a scenario that is becoming more and more likely, then the recent price action will become more meaningful.
Don't miss Leading Indicators Show US, Global Economy at a Tipping Point
From an economic perspective, we're beginning to see a sustained deterioration in the upward trajectory of some leading indicators. The Conference Board's Leading Economic Index (LEI) is shown below in blue, and you can see the recent choppy action that is reminiscent of the end of the last economic expansion (black circles).

Last month the LEI rose 0.1%, but the LEI had declined during each of the previous two months. A slowing of the upward trajectory should not be confused with the transition into a downward trajectory, but this metric does suggest some continued weakness ahead.
The preceding content was an excerpt from Dow Theory Letters. To receive their daily updates and research, click here to subscribe.


