


The discussion around the world in the aftermath of the European meetings focused on the “yes, but” portion of the agreement. Yes, there is an agreement, but it still needs to be ratified by all the members. Yes, the agreement addresses some of the financial strains, but does not address solvency issues of various governments and banks. Yes, the week-long summit was deemed a success, but this is at least the tenth meeting and likely not the last trying to address the problems within the European Community. Here at home the discussion has focused more on the economy than the growing debt problems that the US also faces. Here too are more “yes, but” responses to the economic reports of the past few weeks. Yes the consumer is spending, based upon Black Friday reports from retailers, but the aftermath as reported Tuesday show sales were only modestly higher. Yes, manufacturing in the US is growing – according to the monthly ISM release early this month, but it seems to be the only manufacturing report around the globe showing growth. Finally, the Fed meeting on Tuesday put an exclamation point on this exercise, yes rates are low and going to stay low, but those rates have yet to spur persistent economic growth. Yes, economic growth is better than it has been, but nowhere near what it needs to be to significantly reduce unemployment or increase worker pay enough to provide sustainable economic growth.
What is to follow is a graphical view of a few interesting charts that, I think, show some of the issues within the economy and may help explain some of the action in the equity markets (when it isn’t moving on European news!). First up is the very controversial money supply numbers. Many have pointed out that the huge amount of money sloshing around the financial markets, which may be some of the reasons for the all in/all out mentality of investors and traders alike.

M3 money supply, the broadest measure of money in the economy was discontinued years ago and many people have worked to reassemble this number from various data sources to come up with a reasonable estimate of M3 and from there the annual growth rates. Above is a chart the last few years of MZM, the most liquid money supply available – on a year/year calculation. Having checked a few of the M3 recalculation websites, the overall shape of the curves are very similar, with the percentages roughly 5% or more lower for M3. A couple of points on this chart: first, we are seeing a lower ramp up of money supply over the past decade, from over 20% peaking late in ’01, just over 15% in mid-’08 and the recent peak under 10% just a few months ago. Some may point to these monetary “injections” as sure signs of higher inflation in the future, the truth is these jumps in monetary aggregates are not having the same impact on the economy for one simple reason, money isn’t getting turned over, it is being held. Commonly called the velocity of money, this measures how rapidly money moves around the economy. This figure has been in decent for much of the past 30 years. So while the Fed is stomping on the gas, very little is getting to the engine to make the economy go.

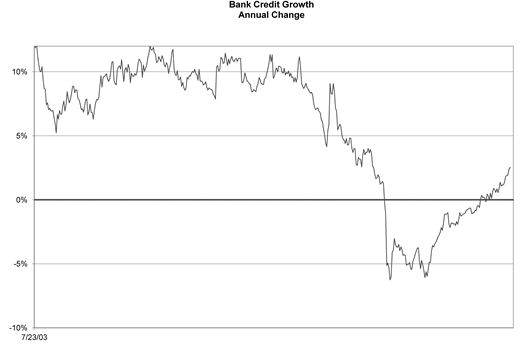
Monetary policy does not seem to be working in the economy today. However, there are parts of the economy that have been under pressure for years that are coming to life: loans. Taking a look at the weekly bank credit figures as reported by the Fed, credit growth is beginning to grow at more normal levels. After collapsing in advance of the financial meltdown in 2008, the commercial bank credits have been expanding at a 2% annual rate, still well below the 5-10% range over the history of this series. After spending roughly 18 months contracting from late ’09 to mid-’11, loan expansion is beginning to take place. The same is true of commercial and industrial loans, after nearly two years of contraction; these loans are beginning to normalize between 5-10% annual growth rates. Obviously, businesses are beginning to believe that while not back to normal levels, investments in plant and equipment as well as commercial property are beginning to make sense.
Finally, one thing that surprised me over the past few weeks was the decline in the CRB index, especially in relation to year ago levels. With energy comprising 39% and agricultural 41% of the total index value, it can be argued that the index does a reasonable job of capturing inflation pressures in the economy. For those filling gas tanks recently have noticed the decline in prices at the pump are fairly close to year ago levels, although still about 20% above summer ’10 levels. Agriculture prices have also fallen rather dramatically from late summer, corn down 30% and sugar down 2%, while cattle prices are roughly the same as the beginning of the year. When looking within some of the food inputs, prices are coming down or at least stable.

So what are the charts saying? To me, the low interest rate environment is likely to be around for quite some time as prices stabilize (and even fall). While the banking side is beginning to get healthy, there is a long way to go before the loan market actually begins to demonstrate the recovery is more than just a bounce back from the contraction of 2008-2010. Further, one item left off the chart list is the dollar, which has been actually gaining strength. Of course it helps to have a weak opponent; however the higher dollar will help keep the lid on commodity prices (much in the same way the weaker dollar boosted prices in the past). There is little in the various charts indicating an overheating economy that will force the Federal Reserve to raise rates, while cutting them was taken off the table with their zero interest rate policy. So interest rates are likely to remain right where they are for the time being – at least through the early part of 2012. At which point, if the loan growth continues to grow and IF monetary velocity can tick higher, concern about rapid growth would then be on the table along with likely interest rate hikes. As of now that is not in the cards.


