


When it comes to predicting recessions or major downturns in the stock market, the yield curve is an important one to watch. It is so good in its predictive analysis that NBER declared it as having predicted every recession in the US since 1970. That sounds like an indicator one should probably reference every once in a while, especially when we start hearing the word “bubble” being tossed around.
So what is it exactly? The yield curve shows the amount of interest charged (or yield earned) as you move from short to long-term debt. The most followed yield curve is for US Treasuries, showing 3-month T-Bill yields all the way up to 30-year T-Notes.
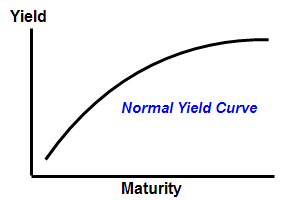
So just how does the yield curve predict recessions? When it inverts. A normal yield curve exists when short-term interest rates are low and long-term interest rates are high due to a premium for holding long-term bonds. This is called a positive sloping curve. In a normal economic environment where the economy is growing and there are low inflation expectations, banks make money by lending money long-term at higher rates while paying depositors low rates tied to short-maturities. When interest rates invert, banks are paying higher rates of interest on deposits than they are making in loans. This squashes the credit machine, banks pull back on lending, the stock market heads lower, and the economy contracts.
Here are two examples of the yield curve inverting at or prior to the 2000 and 2007 crashes:


(Note: If they say a picture is worth a thousand words, how much is a video worth? If you have 1 minute of time to spare, click on the animation button on StockChart’s dynamic yield curve page (click here). You can literally watch how the yield curve predicted the 2001 and 2008 recessions as seen above.)
Before there’s a credit collapse, usually there’s a credit bubble. This is caused by hugely profitable loans when the interest rate spread is wide between short and long-term maturities. Interest rate spreads are wide when we have a steeply sloping yield curve. Credit standards are lowered because the banks get overzealous at high levels of profit. But, with loans out to unworthy borrowers, who’s left to borrow? The Federal Reserve Bank sees the credit bubble and begins raising rates it charges banks on short-term loans – usually until something breaks.
Lending Standards
The chart below shows lending standards coupled with the yield spread between 10-year and 2-year notes. As you can see, it’s when the yield spread is low that banks begin to tighten lending standards, which typically leads to a recession down the road. And yield spreads are low when? When the yield curve is flat or inverted.
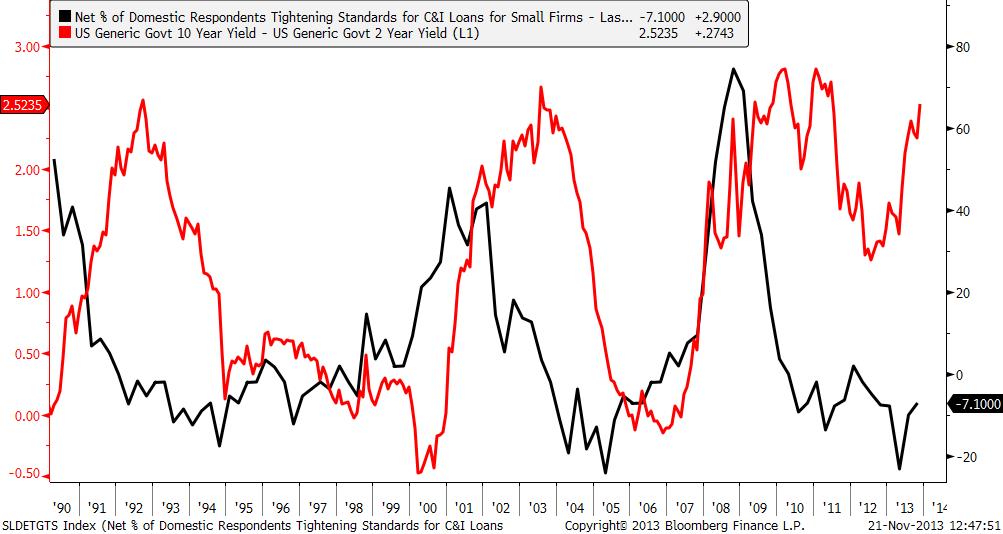
Source: Bloomberg
Keep in mind, the stock market’s downtrend or uptrend can last a while despite the yield curve changing. That’s to say that it’s not a perfect timing indicator, but it’s not something one should ignore either. It takes time for market sentiment to change. Housing prices topped mid-2006 but the housing and credit bubble didn’t affect the stock market until the end of 2007.
The final chart I wanted to show is a table from Wikipedia on the yield Curve. It shows how all of the recessions in the US since 1970 have been preceded by an inverted yield curve. The chart shows the data of the inversion, the date of the start of the recession, the time it took until the recession started, how long the curve stayed inverted, and the duration of the recession. At the bottom, it shows the averages as well as standard deviation since 1969. On average, recessions start 12 months after the yield curve inverts.

Source: Wikipedia
Current Curve
The current yield curve is nowhere near inverted. With the Federal Reserve and its lead foot on the accelerator, short-term rates are expected to remain low until 2015 or later. Things could change, but it doesn’t look likely at this point. Recall that long-term rates began to rise this year. The Fed, obviously watching the situation, decided not to taper their purchases in September when it looked like the economy was satisfying the assumed criteria the market had formulated. Rates have risen and housing sales have been dropping. The Fed is watching this closely and wants to make sure the housing market is in a healthy and steady recovery by keeping long-term rates in-check as well.

Are we in a credit Bubble? Lending standards are low. That’s part of the criteria, but so is a flat or inverted yield curve. The yield spread between long-term rates and short-term rates is only widening as shown in the Bloomberg chart above. We won’t see lending standards begin to rise until that spread narrows. It’s only when that happens that credit is crunched and a bubble can pop. Mind you, even if the yield curve was inverted, it takes time for sentiment and the economy to change as well. On average, since 1970, it takes twelve months after the yield curve inverts for a recession to begin. We can have 10-15% corrections in the stock market as in 2010 and 2011, but these weren’t the beginnings of a recession - merely corrections in an ongoing bull market. For two years, I’ve been bullish on the financials and four years bullish on the market. I still am, despite the bubble calls. Based on lending standards, the yield curve, and the yield spread, there’s no credit bubble here. The business cycle looks healthy to me.


