


There are two misconceptions about the silver market that are still held by many investors in the precious metals community. One is the notion that the world produces large annual silver surpluses and the other is the low cost of mining silver. Some have argued that the investors have been deceived by certain aspects of the silver industry to believe these two fabrications.
Before we get into destroying the myth (once and for all) behind the so-called silver surpluses, here is the definition of surplus:
sur·plus - the amount that remains when use or need is satisfied.
For silver to be in a true surplus, all use and need must be satisfied. However, according to GFMS and the World Silver Survey, investment demand is not a part of that calculation. This is how GFMS figures their annual silver surplus-deficit.
Mine Supply + Scrap - (Fabrication - Coin & Medal) = surplus / deficit
If we input the 2011 figures from the 2012 World Silver Survey published by the Silver Institute, this is the result:
761.6 mil oz + 256.7 mil oz - (876.6 mil oz - 118.2 mil oz) = +260 mil oz
So, in 2011, the silver market produced a record 260 million ounces of silver surplus... or so they say. In the article Silver Surplus: What Silver Surplus?, the author took the silver surplus-deficit chart from a previous article of mine and presented the data in way I had not realized.
The World Gold Council puts out a supply-demand table for gold every quarter. In the Q3 2012 table below you will see included in the demand portion of the calculations are investment bar & coin, ETF & similar and official sector purchases. The highlighted yellow rows show the total gold supply and demand. The OTC investment and stock flows are used to balance out the small surplus or deficit each quarter.
There is speculation that a great deal more "unofficial gold" has been moving from west to east in 2012 that is not being accounted in the official World Gold Council statistics. While this may be true, at least table below gives us a guideline how "official" supply and demand figures are calculated.

If we look at the 2011 column we will see that total gold supply was 4,505 metric tonnes while total demand was 4,585.7 metric tonnes, including a deficit of 80.6 metric tonnes. Thus, the world suffered a 1.7% gold deficit in 2011.
Now, if we look at the supply and demand figures for silver from the Silver Institute, we can see that investment demand does not constitute a "need" or "use" in their calculations:

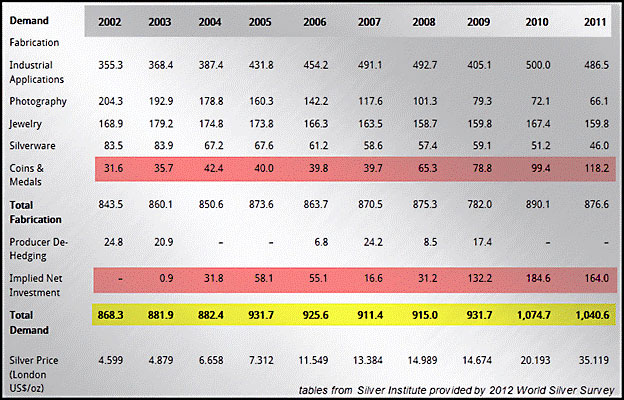
The highlighted yellow rows reveal how supply and demand are made to balance out each year. However, the surplus is figured by omitting all investment demand. If we add up the 2011 "Coin & Medals" and "Implied Net Investment" , we get a total of 282.2 mil oz. This is not the exact surplus figured above which was 260 mil oz... but at least it's in the ball park.
Basically, implied net investment is used to balance out silver supply and demand. But, that doesn't mean that it denotes a surplus. As I stated in my article The Forces That Will Push Silver Over 0, of the 164 million ounces of implied net investment in 2011, the 2012 World Silver Survey attributed 96 million ounces of that total was in the form of physical bar investment.
If we add up coin & medal demand of 118.2 mil oz (this is official coins such as Silver Eagles & Maples and etc.) plus the 96 mil oz of physical bar investment in 2011, we get a total of 214.2 mil oz. GFMS would like the world to believe that there was a 260 mil oz silver surplus in 2011, whereas if we subtract 214.2 from that figure we end up with a paltry 45.8 mil oz remaining.
Don't get me wrong, I am not saying that this 45.8 mil oz is a surplus, but at least it's a more realistic figure. We don't know for sure how much of that remaining amount may have gone to official sector purchases or exchange warehouse investments, such as the Comex.
By updating the 2011 Silver Surplus put forth by GFMS, we have the following:
GFMS 2011 Silver Surplus = 260 mil oz / 1040.6 mil oz = 25% surplus of total supply
Updated 2011 Silver Surplus = 45.8 mil oz / 1040.6 mil oz = 4.4% surplus of total supply
Well, there you have it. If we determined the annual silver surplus-deficit the same way as the World Gold Council calculates gold, there would be no so-called huge silver surpluses. However, the silver industry and investors have been indoctrinated to believe that silver is just a mere slave to fulfill the demands of its industrial masters. Institutions, individual investors or the public who have the "need" or "use" to acquire silver as investment -- need not apply.
Putting the So-Called Enormous Silver Surplus into Perspective
On Dec 13, Jeff Christian of CPM Group was interviewed on BNN stating, "that due to enormous silver surpluses in 2013, the price of silver would outperform gold on the way down." Already, GFMS is forecasting a 300 million oz surplus for 2012 (according to their formula). This can be seen by their "From Deficit to Surplus" chart in their 2012 Silver Institute - interim report released in November (with my annotations):

By looking at the chart above, we can see how the surpluses have been trending higher. Again, these are annual silver surpluses calculated by the formula developed by GFMS, removing all silver investment demand. The two red arrows show the increased gap in these so-called silver surpluses from 2010 to 2011. GFMS calculated the annual silver surplus to be 189 million oz in 2010 and 260 million oz in 2011. Interestingly, as the silver surpluses increased nearly 71 million oz the following year, the average annual price of silver rose from .19 (2010) to .12 (2011).
Mr. Christian believes that there will be "Enormous" silver surpluses in 2013, which would impact the price of silver in a negative fashion. While I agree that it is possible that industrial silver demand may indeed decline in 2013, we really have no idea of what the silver investment demand will be like -- especially when QE4 starts in January and the Fed can purchase billion in U.S. Treasuries a month.
It is quite possible that the surpluses of silver may increase in 2013. However, to say these surpluses with be enormous, no longer makes sense once we allow investment demand to be a part of the surplus-deficit equation as a real "use" and "need" by the investing community.
Now that we have solved the myth of huge silver surpluses, let's examine how the industry has deceived the investing community into believing silver mining costs are low.
If Silver Mining Costs are so Low, Where's all the Profits?
The biggest deception put forth by the precious metals mining industry is the use of CASH COSTS in determining the actual cost of mining silver (or gold for that matter). According to the 2012 World Silver Survey, the cash cost for mining silver in 2009 was .02 an ounce, .47 in 2010 and .25 in 2011. With that sort of cost structure, the silver miners should be laughing all the way to the bank.
Now, I am not the only one who believes cash costs are bogus in determining the real cost of mining silver or gold. Finally, we are getting mainstream analysts stating the same thing. According to the article Cash Cost Fairytales and the need for management discipline in the gold sector:
"Today," he says, "with high gold prices they are booking profits yet they still mark themselves on this cash cost measure. Of course governments are the only people that believe that gold companies are producing gold at 00-plus margins and in their view this is a windfall profit the company is reaping at the expense of the state. Companies need to talk in terms of total cost to produce an ounce of gold."
Aldis continues that, if one looks across the 65 largest gold companies it monitors, the all-in cost to produce an ounce of gold this year is about 00.
The only area I would differ with the quote above is the claim that only foreign governments believe in cash costs put forth by the mining companies. I still come across a good percentage of investors (and some analysts) who still believe it only costs - an ounce to produce silver.
Before we get into the costs of mining silver, let's take a brief look at gold. This is also a good time to explore the recent statement by Paul Van Eeden, "that the fair value for gold is about 0 an ounce." Paul calculates his fair value for gold by looking at the U.S. money supply and inflation growth. So, according to Van Eeden, gold is now overvalued by nearly 0 an ounce.
Now, if you were a simple precious metal investor without an in-depth knowledge of the gold market, this sort of analysis may keep you up late at night. On the other hand, if your business was mining gold, then you would realize just how silly Mr. Van Eeden's values appear to be.
As the article stated above, "all-in costs to produce gold from 65 miners is about ,300 an ounce." To get my own version of the actual all-in costs to mine gold, I gathered the data from Q3 2012 on the top 5 gold miners (Barrick, Newmont, AngloGold, GoldFields & GoldCorp) and put it in the table below:
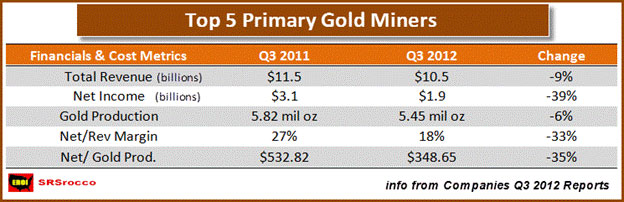
Here we can see that not only did total revenues decline billion year over year, but net incomes fell 39% from .1 billion in Q3 2011 to only .9 billion in Q3 2012. If we take the total net income of the group in Q3 2012 and divide it by their total gold production, we get a 8 net income gain per oz of gold (shown as Net/ Gold Prod. in the table).
Before I get any hate mail from mining accountants or investors, let me explain my method. While I realize that net income may not be the best way to calculate the exact cost of mining gold, the end result comes a great deal closer to the ,300 an ounce figure stated in the article above and is more realistic than the bogus cash cost metric.
Moreover, I decided to break it down even further. I went back to the Q3 2012 reports and tallied up all the copper and by-product revenue. I estimate that 85% of the total revenue came from gold sales alone. Thus, if we subtract 15% (copper & by-product credits) from the net income we would end up with an estimated "Gold only" net income of .61 billion. This would be the result:
.61 billion net income / 5.45 million oz = 5 gold net income gain per oz.
If we subtract the 5 from the average price of gold (kitco) in Q3 2012 of 54.80, we end up with 59.80 all-in cost per ounce. Again, I realize the total sales of gold during the quarter were different from what was actually produced, but at least we get a good ball-park figure in the profitability of the gold mining sector through these top 5 gold miners.
So, for the world to realize Mr. Van Eeden's fair value of gold at 0 an ounce, the gold miners would have to lose 0-0 an ounce (as well as their 0-0 profit). When I first wrote about this in several of the precious metal blogs, one of the members forwarded my post to Paul and he replied by saying "it means you change the cut-off grade. The whole industry can, and will adjust."
I was completely astounded by his solution. How much can the miners change their cut-off grade and make money at 0 an ounce? If we look at Barrick's Annual Reports, their average reserve ore grade has fallen substantially over the past several years (figures in ounces per tonne and at year end - Dec 31st):
Barrick's Proven Reserve Average Ore Grade
2008 = 0.057 oz/t
2009 = 0.052 oz/t
2010 = 0.048 oz/t
2011 = 0.045 oz/t
In just three years, Barrick's average reserve ore grade has declined 21%. If we look at their average ore grade for Q3 2012, it was 0.054 oz/t -- the quarter they posted a 55% decline in net income compared to the same period last year. Furthermore, Barrick's cost of sales increased from 38% in Q3 2011 to 50% this past quarter. So, how much can they really adjust their cut-off grade and remain profitable?
With the understanding that break-even for the majority of gold miners is now ,300+ an ounce, how can the market value gold at 0 an ounce? Of course, some say that demand is an important factor as well, but given the rapidly disintegrating financial system around us, who really thinks gold demand is going to fall anytime soon?
If the 39% decline of net income in the top 5 gold miners Q3 2012 y-o-y was bad, just take a look at the beating the top 10 primary silver miners received during the same period:

(companies included were Pan American Silver, Coeur, Hecla, First Majestic, Silver Standard, Silver Corp Metals, Endeavour, Fortuna, U.S. Silver & Alexco Resources). Fresnillo was not included due to the fact that more of their revenue comes from gold than silver and Hochschild only reports their financial results on a bi-annual basis.
Here we can see that the top primary silver miners net income declined 78% y-o-y, twice the percentage of the gold miners. Not only did the primary silver miners total revenue fall from 4 million in Q3 2011 to 5 million Q3 2012, it did so while the group produced an additional million ounces of silver.
For those readers-investors who believe the silver miner's total revenue may have declined due to some in the group holding onto more of their silver production... let me share with you this tidbit. The top 5 primary silver miners in the group had total production of 16.5 million oz during Q3 2012. However , their combined sales that quarter of silver was also 16.5 million oz -- basically a wash.
So, the reason for the huge decrease in net income y-o-y was due to both the increased cost of sales as well as the much lower price paid for silver. By using the same approach as we did in the gold table, the top 10 primary silver miners net income per ounce declined from .06 oz in the third quarter of 2011 to only .53 an ounce this last period.
Furthermore, I decided to add up the same top 5 primary silver miners by-product credits which turned out to be 28% of total revenue. To be conservative I reduced the net income by 25% giving an estimated total silver net income of .7 million. This was the net effect:
.7 million / 21 million oz = .89 silver net income gain per oz
Again, this is my approach for getting a more "common sense" break-even cost for these primary silver miners. If we take the average price of silver in Q3 2012 of .91 (Kitco) and subtract the .89 silver net income we end up with an all-in cost of .02 an ounce. Even though the miners receive different realized prices than the average stated Kitco price in the example above, it turns out to be a very close indicator.
For instance, here is a sample of the average realized price of silver paid by top primary silver miners during Q3 2012:
Q3 average realized silver price
Pan American Silver = .27
Coeur d' Alene = .09
First Majestic = .48 (silver eq.)
Silver Standard = .37
Average price = .80
All of the figures presented above show that the break-even cost for mining silver is a great deal higher than the reported cash costs. Here we can see that the primary silver miners' profits have declined substantially as the average price of silver fell from (Q3 2011) to an ounce (Q3 2012). Moreover, four of the top 10 primary silver miners reported a negative income loss during the third quarter of 2012. It's safe to assume that if the price of silver fell to - an ounce while costs remained the same, the majority of these miners would suffer net income losses.
Why Those Analysts Who are Bearish on Silver Will Get it Wrong
The problem facing the precious metal investor today is the seemingly contradictory analysis on the future price of silver. Some are saying the price will be head much higher in the next few years, while others believe the top has already been seen.
Jeff Christian gave his 2011 forecast on silver during a roundtable discussion on FSN Newshour on March 4, 2011 (at the time the price of silver was .50 an ounce):
* The price is going to be where it is now
* The price of silver will fall sharply during the 2nd & 3rd quarter of 2011, perhaps down to -24
* Then basically stay above for the next couple of years, and then move up towards over the next ten years.
Here is a three year chart of silver with a highlighted red zone where I believe the majority of the top primary silver miners would report net income losses:

Silver did not reach the - level and did not take 10 years to move upwards to as Mr. Christian forecasted. To be fair, Mr. Christian was correct, silver did suffer a downward correction in the 2nd & 3rd quarter. However, the average price of silver in 2011 was .12 -- a great deal higher than Mr. Christian's ten year forecast.
Another analyst, Ned Schmidt has stated several times that the fair value of silver is an ounce. He goes on to say that a pure silver mining company is mining silver at an ounce so at they are making big profits. Furthermore, Ned believes that due to the huge amount of silver supply that will come on the market at the end of the year and in 2013 will make silver a risky investment. I disagree with the forecasts of these two analysts.
Before I explain my forecast on the future silver market, it is also fair to say that many of the analysts' extremely bullish silver price projections in 2012 did not come true.
That being said, I believe the future price trend for silver is higher, not lower. Mining costs for silver are going to continue to rise during this decade. Mr. Christian forecasted that silver would trend toward in the next ten years. If this was the case, the majority of the primary silver producers would be suffering net income losses for the remainder of the decade as the all-in cost of mining silver would reach an ounce in the next year or two.
Both Mr. Christian and Mr. Schmidt believe huge silver supply and surpluses will make silver a risky investment in the future. While I believe there will be more silver supply coming on the market in the next few years, I don't believe this is necessarily bearish.
First, I proved in the beginning of the article that the so-called "Enormous" silver surpluses are more a product of accounting than they are a reality. In 2011, there wasn't a real 260 million ounce surplus of silver. Once we included investment demand (as is done by the World Gold Council in determining their surplus-deficit for gold), the remainder was only 46 million ounces. And, of this remaining 46 million ounces, we are not sure how much went to other investment vehicles not detailed by the Silver Institute and 2012 World Silver Survey.
Second, the low cost of mining silver is more a myth than an actuality. Mr. Schmidt believes that the fair value of silver is $16 and a pure silver miner can make profits at this level. Even though this may be true for a few of the primary silver miners, it is not true for the majority of the group. If it was, then the top 10 primary silver miners would be showing huge net income gains in Q3 2012, instead of 6% net income margin to total revenues.
Third, increased future silver supply is not a guarantee that silver will become a risky investment. The biggest problem I have with this sort of forecast is that the current global financial system is disintegrating rapidly, while the orthodox analysis remains the same.
There are literally $trillions of dollars of global capital and investment funds looking for a home. The current state of the world's bond markets are a complete mess. At some point in time the $trillions of debt disguised as wealth will start to evaporate, thus starting a stampede into safer physical assets.
For the sake of augment, if there was a supposed 100 million oz surplus of silver in 2013, at $40 an ounce we would have the following:
100 million oz silver X $40 = $4 billion
$4 billion is less than 1% of the forecasted Fed purchases of U.S. Treasuries in 2013
$4 billion is 0.02% of the total U.S. Retirement Market (Q3 2012)
$4 billion is 0.005% of the total Global Assets under management (2011)
As we can see, it wouldn't take much of a shift in the investment funds above to absorb a 100 million ounce silver surplus.
Lastly, to really understand where the price of silver is heading into the future, one has to throw out business-as-usual-orthodox analysis. I believe you have to think outside-the-box to understand how silver will be valued in the future.
It has been investment demand that has been the predominant force in determining the market price of silver since 2004. I believe we are just beginning to see how big silver investment demand will become in the future.
Comments are always welcome at SRSrocco @ gmail.com


