


The biggest problem for investors today in trying to forecast the future price of silver is the enormous amount of contradictory analysis on the Internet. There are bulls, bears, paper traders, physical buyers, technical analysts, hedge funds, commercial banks and silver manufacturers all trying to play a part in this highly volatile silver market. Trying to sift through the huge volumes of silver analysis on the internet can be extremely frustrating. In addition, some of this information is not meant to inform, but rather to confuse or mislead the investor.
There is a great deal of misinformation on the internet when it comes to silver. I find it ironic that one of the so-called “bullion specialists” seems to give bearish commentary whenever the price of gold or silver rises to new highs. This is akin to a CEO of a corporation telling the media and shareholders that the company’s stock price is too high and needs to drop down to more sustainable levels. What CEO on Earth would say something as stupid as this with the best interest of the company and shareholders in mind? Furthermore, how many CEOs would keep their job if they repeated this over and over for the past several years, and got it wrong time and time again?
Unless you have been in the precious metals markets for quite some time, it is easy to be misled by this type of information. This is the very reason behind the motivation that I had to write this article. In it, I will attempt to give the reader-investor a more detailed and fundamental comparative analysis of the future price of silver, rather than the typical fly-by-night technical charting or bull-bear rant. This should give a more commonsense methodology in forecasting the future path of silver and its eventual paradigm shift.
Paradigm Shift: —n, a radical change in underlying beliefs or theory
The coming paradigm shift in silver will not happen due to technical analysis, fundamentals, or supply & demand forces, but rather due to a change in mass psychology of investors. Even though fundamentals and supply-demand forces will play a part in this shift, they will not be the ultimate cause. I believe technical analysis as it is used today, only charts the amount of manipulation and mass psychology in the silver market.
Throughout history, a paradigm shift occurs in rigged markets when the manipulation of the financial system and economy is no longer sustainable. This occurred in the banking and housing markets in 2007-2008 when we had what I call a “Negative Paradigm Price Shift”- a trend where prices or values are declining.
Negative Paradigm Price Shift in Housing and Banking
Prior to 2007, the real estate market was kept alive by the work of clowns and magicians in the mortgage industry and banking system. For several years everyone was having a great time. As housing prices and sales continued towards the heavens, bank profits hit all-time records. Everything was going along just fine until the market realized one day that there was nothing left after “Liars Loans” were levied to keep the Ponzi going. Once the housing market collapsed, so too did the banking system. Like two twins attached at birth, one could not live without the other.
In true waterfall fashion, investment banks, commercial banks, government-sponsored entities and insurance companies went bankrupt, were either taken over or became a mere shadow of their former selves.
Here we can see several examples of a Negative Paradigm Shift:


As you can see from these 10-year charts, the prices of these stocks were range bound prior to 2007. All of a sudden, in the middle of 2007, the bottom fell out and the prices of these stocks suffered exponential losses. Other examples of companies that have experienced similar Negative Paradigm Shifts include Lehman Brothers, Bear Stearns, Merrill Lynch, Washington Mutual and Freddie Mac.
How could all of these institutions collapse in this fashion? It was due to policy deregulation as well as the manipulation of financial products, assets and information. Thus, the banking system and these institutions were functioning and supposedly solvent a great deal longer than a free market would have allowed. The act of misleading the market gave false values and elevated stock prices.
This is a perfect example of the mass psychology of the public investing in highly inflated assets based on superficial and bogus technical analysis. As the housing and financial markets were reaching their peak in the 2007, fundamentals played no part in their real market values— it was based entirely on mass psychology instead; the false belief projected by investors and the corporations themselves that these companies were actually of high value.
This disintegration of the housing market and banking system was not an isolated episode; rather it was part of the events that take place in STAGE 1 of what Dmitry Orlov calls the Five Stages of Collapse.
- Stage 1: Financial Collapse
- Stage 2: Commercial Collapse
- Stage 3: Political Collapse
- Stage 4: Social Collapse
- Stage 5: Cultural Collapse
According to Orlov:
STAGE 1: Financial collapse. Faith in "business as usual" is lost. The future is no longer assumed resemble the past in any way that allows risk to be assessed and financial assets to be guaranteed. Financial institutions become insolvent; savings are wiped out, and access to capital is lost.
Here we can see that the majority of these conditions in the Financial Collapse have already taken place. The only reason why the U.S. banking system is still functioning today is due to the ability of banks to mark to model their assets giving the impression that they are still solvent. Furthermore, the increased guarantee of FDIC deposit accounts to 0,000 as well as a temporary unlimited coverage for noninterest-bearing transaction accounts until Dec 31, 2012 have kept a major bank run on the banking system. These changes of policy have postponed the United States from entering into STAGE 2 or the Commercial Collapse. This will be discussed at the latter part of the article.
If this wasn’t bad enough, the current U.S. banking system is based on a fractional reserve requirement of 10% in fiat money; basically paper backing paper. This wasn’t always the case. To get a better idea of how disastrous the present banking system has become, we need to take a look at fractional reserve requirements of the past.
From an Historic Gold-Backed Fractional Reserve System to a Paper Farce Today
Eric Sprott made a recent comment posted in an article on Zerohedge.com, stating that “The financial system is a farce”. He couldn’t be more correct in his assumption. Not only is the present U.S. banking system based on a financial debt instrument called a Federal Reserve Note, but its fractional reserve ratio is virtually nonexistent.
In 1932, the United States had a fractional reserve banking system backed by gold. The member banks had different reserve requirements: central reserve city banks (13 percent), reserve banks (10 percent) and country banks (7 percent). All member banks had a 3 percent reserve requirement on time deposits. Even with these official reserve ratios, the total paper dollar claims to gold were much higher. For this analysis, we are going to compare the M2 money supply to the amount of U.S. Treasury-held gold.

In 1932, the U.S. Treasury held .95 billion in gold, there was .60 billion in currency in circulation, billion in M2 money supply, and billion in U.S. Treasury debt. The fractional reserve of gold to the M2 money supply was 8.3%.
Despite the terrible conditions during the “Great Depression”, at least the country had two positive factors going for it: 1) A banking system backed by gold and 2) vast resources of energy, metals and minerals to tap into to pull itself out of its current market ills.
Today, the banking system is on the verge of collapse and the country has consumed its best resources which peaked 40-50 years ago. After Nixon dropped the dollar peg to gold in 1971, the world has been on a floating exchange rate fiat monetary system. The present fractional reserve banking system we have today is based on a fiat paper reserve.

This graph shows that no gold whatsoever is backing up the banking system. As the U.S. banking system stands today, its currency— the Federal Reserve Note— is backed by .2 trillion worth of U.S. Treasury debt. The system is even weaker when we look into the makeup of the banks’ fractional reserve ratio.
For starters, the official 10% minimum reserve requirement set by the Board of Governors at the Federal Reserve applies to mainly checking accounts. Effective December 27, 1990, CD’s, savings accounts, and timed deposits owned by entities other than households were not included in this 10% reserve requirement. Additionally, in 1994 the Federal Reserve Board passed a “Deposit Reclassification” for financial institutions to help lower reserve requirements even further. Eric DeCarbonnel explains this in his article “US Banks Operating without Reserve Requirements”:
Deposit reclassification is an accounting trick, used by virtually the entire financial sector, which allows banks to eliminate nearly all their reserve requirements. Deposit Reclassification splits a checking account into two separate subaccounts, a transaction (checking) subaccount and a non-transaction (savings) subaccount. This distinction only exists on the bank's books: you will never see these subaccounts on your bank statements.
Deposit reclassification means that, at any point in time, most of the money in American checking accounts sits in invisible savings subaccounts. These savings subaccounts pay no interest, but allow banks to avoid reserve requirements. The public is completely unaware of this financial engineering.
It is now apparent that the so-called official 10% fractional reserve ratio of the U.S. banking system is just a mere figure to delude the public into believing it has a working cash reserve ratio, whereas in reality, the system is a complete farce.
The public has no clue just how weak and vulnerable the U.S. banking system has become. At one time, the United States had a fractional reserve banking system backed by physical gold money. Today, its financial system is entirely based on a fiat monetary regime with practically no fractional reserve ratio whatsoever.
Gold & Silver Money Contain Intrinsic Value; Federal Reserve Notes Have None
Not only is the majority of the public ignorant to the amount of dangerous leverage in the U.S. banking system, most have no understanding of real money. I have had several debates on various websites with highly educated individuals on the subject. Some have replied by stating, “The U.S. Dollar is backed by the GDP of the country”, while others have insisted that, “Gold & silver have no intrinsic value whatsoever.” It is no wonder this country is heading full speed over the cliff.
In historic times, the value of gold and silver was tied to their rarity as well as the amount of labor needed in extracting and producing the metals. As time went by, capital became a larger percentage of this value while human labor was replaced by energy-consuming machinery. Each gold and silver coin produced today contains a certain amount of this capital investment, energy and labor cost. Thus, these precious metal coins do hold a certain amount of intrinsic value.
On the other hand, a Federal Reserve Note today has no intrinsic value at all— except for its printing cost. It is only a promise to pay. The Federal Reserve Note is not redeemable by gold, but Uncle Sam will give you some of its .2 Trillion of U.S. Treasury debt in exchange. It is due to this very reason why we see an increasing amount of Americans buying Gold and Silver Eagles.
The U.S. Mint does not provide the public with annual records of exact dollar sales of their Gold and Silver Eagles. To get the figures below, the annual sales of silver and gold eagles were multiplied by their respective average yearly price reported by Kitco.com.
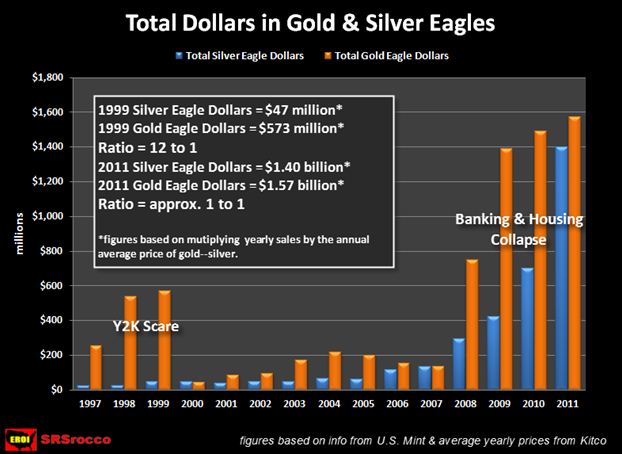
In times of worry in the financial system, the public regains confidence through buying gold and silver assets. During the Y2K scare, we can see that Americans were putting a great deal more money in Gold Eagles over Silver Eagles. In 1999 the public was buying 12 times the amount of money in gold than silver. Today, we see that investors are spending almost the same amount of money in both precious metals.
The graph above only reveals part of the story. According to kitco.com, the average price of silver in 2011 was .11 and the average price of gold was 71.52. This gives us a gold-silver ratio in 2011 of 45 to 1. If we look at the next graph below we can see just how much more Silver Eagles over Gold Eagles the public is buying.

It is hard to tell from the graph above, but Gold Eagle sales have increased tremendously since 2007. Here are the exact figures for both:

During the Y2K scare in 1999, Americans bought a record 2 million ounces of Gold Eagles and only 9 million ounces of Silver Eagles. This was at ratio of 4.4 to 1. In 2011, the ratio increased nearly 10 times as investors bought almost 40 million Silver Eagles while only purchasing 1 million in Gold Eagle ounces.
Very few individuals have comprehended the amazing trend taking place in the Gold and Silver Eagle’s market. In 1999, Gold Eagle sales hit a record of 2 million ounces. Last year, investors only bought half that amount. However, Silver Eagle sales have increased more than fourfold from nine million oz in 1999 to nearly 40 million ounces in 2011.
Even though these two graphs give overwhelming evidence on how much more investors are buying Silver Eagles over Gold Eagles, it is only part of the story.
Comparing U.S. Domestic Gold-Silver Production vs. Gold-Silver Sales
In my previous article, First Time Ever, Silver Sales Surpass Domestic Production, I explain how Silver Eagle sales are forecasted to be higher than the total 2011 U.S. domestic silver production output (full data on U.S. silver mine production will not be out until April-May of 2012). This is a graph from the article that shows Silver Eagle sales will be approximately 5 million oz greater than U.S. domestic silver production:

While it is true that the U.S. imports silver to meet its industrial and investment demands, this amount was two and a half times its 2010 mine production. According to the USGS 2011 Silver Mineral Summary, the United States had a net import of 3,240 metric tons of silver in 2010. Compare that to its mine production of only 1,280 metric tonnes the very same year.
On the other hand, if we look at the USGS 2011 Gold Mineral Summary, the United States had a net import of 160 metric tonnes of gold in 2010 while its domestic mine production was 230 metric tonnes. Here we can see that the U.S. gold mines produce one and a half times more gold than it imports from foreign sources.
In 2011, the United States is estimated to produce roughly 7.5 million oz of gold (233 metric tonnes) along with one million oz of Gold Eagle Sales:

Looking at these two graphs the difference becomes extremely obvious. Silver Eagle sales consumed 114% of U.S. domestic silver production in 2011, whereas Gold Eagle sales accounted for only 13.5% of domestic gold production.
The public is beginning to understand that silver offers a much more affordable way to protect one’s wealth than gold. This realization has now taken a bigger bite out of the U.S. domestic silver production pie than is available. Even though the United States can import silver presently to supply its investment and industrial demand, this situation will change when the U.S. economy enters into STAGE 2 of the collapse.
When Will the Paradigm Shift in Silver Occur?
For the most part, Americans are completely oblivious of just how close the country is to a total disintegration of its fiat monetary system. As I mentioned in the beginning of the article, the United States financial system died in 2008. It has been kept alive by policy deregulation, monetary printing, and market manipulation (including derivative manufacturing such as interest rate swaps). These collaborative short term machinations have a lifespan that is diminishing every passing day, while investors who have made the wise decision to exchange fiat money for gold and silver keep wondering how long this manipulation can continue.
I remember watching Peter Schiff on CNBC and Fox Business between the years of 2005-2007 debating about the upcoming collapse of the mortgage and housing markets. On several occasions, Schiff was the laughing stock on the set as anchors and other guests thought he was simply crazy in his forecasts. By 2008, the laughs had stopped while the country watched as the U.S. housing values began their rapid decline that would eventually surpass the disastrous records set during the 1930’s Great Depression.
The answer I give to individuals and investors who ask me the question “when will the manipulation end?” is that it will end when the U.S. enters into STAGE 2 or the Commercial Collapse.
Again, according to Orlov:
Stage 2: Commercial collapse. Faith that "the market shall provide" is lost. Money is devalued and/or becomes scarce, commodities are hoarded, import and retail chains break down, and widespread shortages of survival necessities become the norm.
Despite the forecasts of many analysts of what the U.S. Dollar index or government deficits will look like in the next decade, the U.S. economy will enter into STAGE 2 more likely than not in the next few years. The commercial collapse as described by Orlov is when the whole country will feel the impact of the ongoing economic disintegration.
This article is long enough and does not have time to go into the three other stages of collapse described by Orlov. It is recommended that the reader go to the link provided at the beginning of the article to get additional information on the five stages of collapse.
Briefly, Orlov witnessed firsthand the collapse of the Soviet Union in 1989 and then wrote a book titled Reinventing Collapse: The Soviet Example and American Prospects describing these different stages. According to Orlov, a country does not have to systematically go through all five stages of collapse. But when the financial collapse occurs, the commercial collapse is sure to follow. With all things considered, Orlov believes the overall conditions are far worse in the United States today than they were for the U.S.S.R in 1989.
Currently, an overwhelming majority of the public has not learned its lesson since the collapse of the banking and housing markets in 2008, as they are still heavily invested in the U.S. Treasury and retirement markets. They still cling onto the belief that their paper investment wealth will be safe and provide for them well into the future. The graph below compares the amount of precious metal investment to the total amount of money held in U.S. retirement assets.

Since the American Eagle program started in 1986, there has been roughly .4 billion worth of these gold and silver coins purchased. Currently, the total market value of the GLD & SLV ETF is billion. Furthermore, if we assume a 1% ownership of precious metals by the investment community in the United States, taken from information provided by the CPM Gold Yearbook 2011 (based on 0.7% gold as a percent of global financial assets and adding an estimated 0.3% for silver), we would get a figure of approximately 0 billion in these assets.
The total value assigned to the GLD & SLV is given as a form of reference and not as a recommendation for investment purposes. All paper claims on gold and silver are not a guarantee of owning the actual physical metal. Some vehicles such as the PSLV and PHYS enable the investor to trade in shares for actual metal (under certain guidelines).
According to the Investment Company Institute’s third quarter news release in 2011, the total value of U.S. retirement assets was trillion. The breakdown was as follows: .6 trillion in IRA’s, .3 trillion in defined benefit plans, .2 trillion in govt. pension plans, .3 trillion in private sector defined-benefit plans, and .6 trillion in annuities.
All retirement plans are based on a continued income stream from the market. There is really nothing backing these assets except the faith that the market will continue to grow and function providing the returns to pay its investors when they retire. However, the financial system already experienced its Negative Paradigm Shift in 2007-2008, rendering growth at its necessary rate to perpetually sustain an income stream under a fiat monetary system now impossible.
The graph above indicates the degree of mass psychology in the different investments. Presently, the overwhelming majority is invested in the trillion retirement market. Unfortunately, these retirement assets will go the same way that the housing and financial markets did in 2008-2009. It is only a matter of time.
Gold has been called the “Barbarous Relic”, time and time again on CNBC and Fox Business. There is a certain amount of hubris and ego attached to our present financial house of cards— a paradigm that is coming to an end. Those who believe that gold is a barbarous relic are still drinking that barbarous water, or breathing that barbarous air, or eating that barbarous bread or still cleaning with that barbarous object called a broom. All these so-called barbarous items listed above haven’t changed much since the Roman and Medieval times.
The constant negative rhetoric of gold in the main stream media keeps the mass psychology of the public away from investing in the precious metals and into increasing worthless paper retirement assets.
The Coming Positive Paradigm Shift in Silver
As mentioned before, the paradigm shift in gold and silver will occur when the United States enters into Stage 2, the commercial collapse. This article focuses on silver due to the fact that the majority of gold that has ever been mined is still stashed away nicely in vaults across the world. However, due to silver’s dual role as an investment and industrial commodity, a large percentage of silver that has been mined has been consumed in industrial fabrication and lost forever— continuously diminishing its supply and raising its value.
When silver performs its paradigm shift, it will behave in the opposite fashion as the first three charts in this article. While AIG, Fannie Mae and Citigroup suffered negative paradigm price shifts, silver will be awarded a positive one. The graph below gives a possible representation of this paradigm shift. Repeat… a representation of this paradigm shift:

The 0 Free Market Price of silver was calculated by inputting the Jan. 1980 high price of silver into the inflation calculator at Shadowstats.com. I realize there will be a great deal of backlash on this 0 figure… so here is the rationale behind it:
- This figure was based on the “official CPI statistics”. John Williams at Shadowstats.com has an alternative SGS calculation using older inflation parameters which would make the price much higher.
- The manufacturing of trillions of dollars of derivatives has siphoned investment money away from physical assets such as silver, keeping their prices artificially low.
- The overwhelming number of paper claims (100+ to 1) on every physical ounce of silver has also sucked investment money away from the physical metal, also depressing its actual price.
Even though the last two reasons above can overlap in definition, they were separated due to the type of derivatives experienced in the market. The second reason focuses on the tremendous amount of financial derivatives such as interest rate swaps and retirement accounts. The third deals with the silver derivatives themselves— options, futures, pool accounts, silver certificates and silver ETF’s. The possible paradigm price shift of silver shown above represents a trend when the mass psychology of the market becomes increasingly aware of the true fundamentals of physical assets such as silver. The higher the price goes, the more fundamentally aware the market becomes.
The fact of the matter is that the stocks of AIG, Fannie Mae and Citigroup were garbage and worthless well before 2007. If we were to look at their charts above and draw a straight line from where their current stock prices are today and go back all away across the chart to the year 2002, we would see a fair indication of a free market value.
Yet, the majority of investors today are still suffering from the same mass psychology that kept the financial and housing markets elevated several years ago. Today, the investor’s confidence is placed firmly in the U.S. Treasury and Retirement markets. These are the two final greatest bubbles in history.
The U.S. banking system has no real fractional reserve to speak of and its monetary unit called the Federal Reserve Note is backed by $15.2 trillion in U.S. Treasury debt. The global oil supply is peaking and there will not be the available cheap energy in the future to fuel the U.S. economy to be able to pay back these debts or fulfill the obligations of the current $17 trillion retirement market.
While, the U.S. Govt. and Wall Street may be able to postpone the inevitable for a while longer by printing more dollar digits, issuing more paper treasuries and manufacturing more derivatives, these are temporary solutions. There are other alternatives that the U.S. could opt to take, such as backing the dollar with gold or erasing all the debt and starting over. Unfortunately, these are not the choices that are being considered by the leaders in government.
The paradigm shift in silver shown above is a representation of a possible trend in the future. Anything can change its outcome in time and price. That being said, when global markets cannot avoid heading into an unavoidable negative exponential trajectory as they presently are, (including the U.S. economic system) changes in price or value move up or down quickly and violently.
A change in mass psychology will play a big part in the market realization of the true fundamental price of silver. Silver will outperform gold in percentage terms as it will be more affordable to the masses. The majority of technical charting and a great deal of analysis on the internet are nothing more than white noise to confuse and frustrate.
Lastly, to all the silver investors who are purchasing physical bullion on the dips, remain patient— the silver paradigm shift is coming.


