


US and global stocks remain in a secular Bull market. Major averages from around the world confirm the strength we see in our country boosted by strong earnings and guidance. Tech stocks have trounced value companies and sentiment is neutral in spite of the lofty stock valuations, allowing room for more euphoria. There is an interesting shortage of non-commodity resources without inflation and rising interest rates. Record highly compensated job openings, low unemployment, and a severe housing shortfall should be hallmarks of an overheating economy with credit tightness that starts to stall the economy. Yet, the economy is growing less than most expansions, interest rates are falling, consumer credit risks are low and the worry will be deflation if Oil falls under $40.
Read Stock Market Headwinds Approaching, Says Louis-Vincent Gave
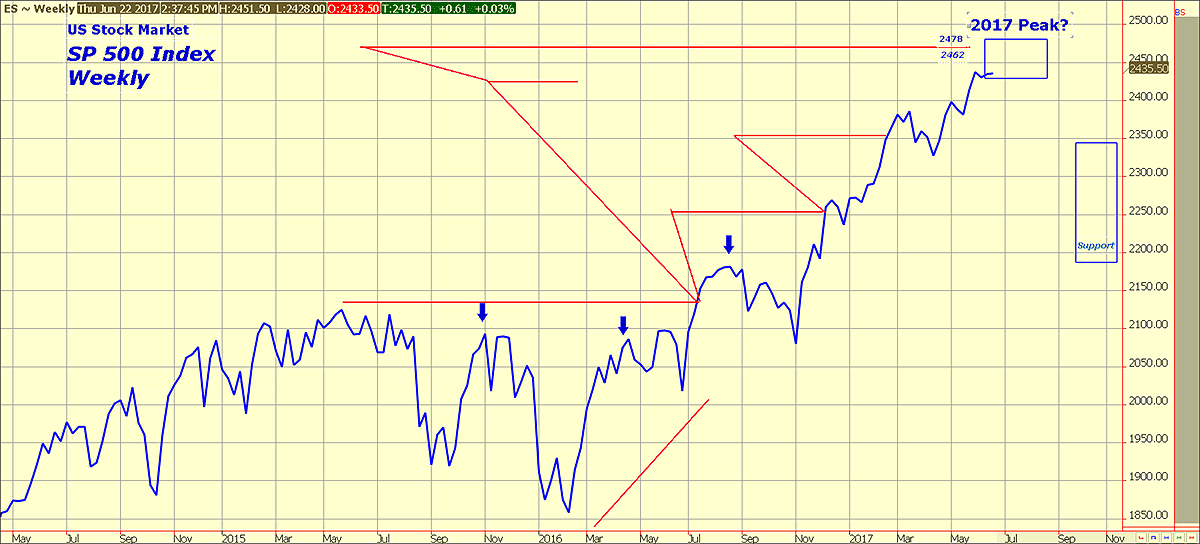
Our Dow and SP targets for our ideal summer 2017 medium term top are close to being reached. Dow 21,400 – 21,800 and SP 500 Index 2440’s to 2480 remain our ideal maximum objectives for 2017. After 2 quarters in a row where S&P 500 Index earnings reached new record levels, there may be some upside staying power as we enter the 2017 2nd Qtr’ reporting season from mid-July to late August. We were bold in assuring there would “not” be any deep corrections to buy bargain stocks throughout the rallies since last November. However, any further new highs from here into our time and price zone for a potential 2017 peak will require close attention for ebullient sentiment and other warnings flags. Corrections into the 3rd quarter should be limited to 5 to 10%, depending upon when and where an important top arrives.

Taking a broader perspective using the benchmark S&P 500 Index reveals the basing power accumulated during the 2015 – 2016 period that uncoiled higher when Trump was elected. While we retain our longer term optimism and may be premature in expecting the first deep correction since last October, we will be looking for signs to validate our forecast for a summer 2017 medium term peak.
A few divergence cracks are forming in energy and breadth. OPEC has been an utter failure and we should thank them for their sacrifice. By holding back from their peak production capacity they continue to transfer Oil production to the US. This is the gift that keeps on giving, until Oil falls too far and the Saudis feel at some point the “scheme” isn’t going according to plan and decide to take an 180, driving prices down below for the first time since 2002. Such a collapse is not in our forecast yet as it would be a dramatic departure from the improving global economic growth scenario we have outlined. An Oil price scare into the mid ’s however, is realistic and we have warned about such a break that would send stock investors to the sidelines as energy and bank stocks take a nosedive.

You may also like Robin Griffiths on 1987-Style US Market Crash and Why He Likes India
Dow Theory requires the Transportation Index making new highs somewhat in sync with the broader Dow Industrials. The current negative divergence that appeared in June is modest so far but would become larger on any new highs by the S&P and Dow Industrials.

To round out the warning flags, we have a negatively diverging Small Cap Russell index along with collapsing telecoms and moribund value stocks in this bifurcated Cloud driven investment environment. Should Oil prices find legs above $40 and establish a new trading range in the low to mid 40’s, then the sum of all fears can be averted. These flags do not mark a dire change in the secular upside for stocks, but thus far they warn that our forecasted correction during the 2nd half of 2017 is still viable.


