


Given how oversold the market was entering this week it’s not surprising to see some stabilization. The S&P 500 was able to reclaim its 50-day moving average (50d MA) though I don’t think we are quite out of the woods as sentiment and other intermediate technical indicators remain only slightly below neutral levels. One noticeable improvement has been sentiment, which has worked off some of the recent bullish levels and moved closer to levels associated with bottoms as both active money managers and retail investors turn overly bearish.
S&P 500 Member Trend Strength
As shown below, the long-term outlook for the S&P 500 is clearly bullish as 84.4% of the 500 stocks in the index have bullish long-term trends. The market's short-term outlook has been downgraded another notch to “Bearish” from our last report while the intermediate outlook remains in bullish territory by a thread at a 62% reading.
S&P 500 Trend Strength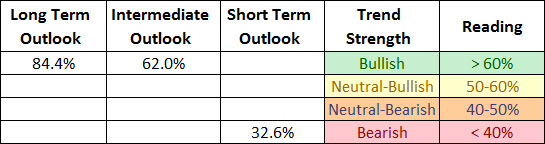
* Note: Numbers reflect the percentage of members with rising moving averages: 200-day moving average (or 200d MA) is used for long-term outlook, 50d MA is used for intermediate outlook, and 20d MA is used for short-term outlook.
The most important section of the table below is the 200d SMA column which sheds light on the market’s long-term health. As seen in the far right columns, you have 84% of the S&P 500 stocks with rising 200d SMAs and 77.6% of stocks above their 200d SMA. Also, nine out of ten sectors are in long-term bullish territory with more than 60% of stocks having rising 200d SMAs, with the weakest sector being the telecommunication sector (33.3%).

Source: Bloomberg
Market Momentum
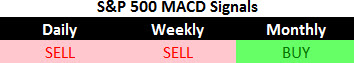
The Moving Average Convergence/Divergence (MACD) technical indicator is used to gauge the S&P 500’s momentum on a daily, weekly, and monthly basis. As seen in the table below, the momentum for the S&P 500 has weakened as the S&P 500 continues to be on a daily and weekly MACD sell signal.
Source: Bloomberg
Digging into the details for the 500 stocks within the S&P 500 we can see that the daily momentum for the market has improved slightly from last week's reading of 12% to 15%.
The intermediate momentum of the market, however, has eroded slightly as the percent of stocks with weekly MACD buy signals has fallen from 47% to 42% this week.
The market’s long-term momentum remains solid at a strong 81% this week, though it has softened a little from the 86% reading seen on July 12th.

Source: Bloomberg
As you can see from the chart below, the percent of stocks with daily MACD buy signals has fallen to levels associated with short-term bottoms, which likens the probability of a short-term rally.

Source: Bloomberg
52-Week Highs and Lows Data
A few weeks ago the financial sector took the top spot with 52-week highs, but now they have softened and lead with the most 52-week lows. Given their long-term trends and momentum remain strong, whenever we do get a good intermediate bottom, this sector might move the most given it is one of the most oversold sectors.

What is encouraging about the market’s condition is that, though 52-week highs diverged with the recent price of the S&P 500 and warned of a deteriorating market in the short-run, 52-week highs continue to dominate 52-week lows as buyers continue to remain strong.

Market Indicator Summary
While we have a short-term low, we may not be that far off from an intermediate low as active money managers and individual retail investor sentiment has swung nearly full circle from overly bullish to bearish. While we haven’t quite seen the extremes in bearish sentiment seen in 2010 or 2011, sentiment is more bearish than what we saw at the June lows and investors should become progressively bullish on their outlook for the markets.

Source: Bloomberg
Summary
We’ve likely seen a short-term bottom as many indicators are deeply oversold like the percent of daily MACD BUY signals on the S&P 500, and with sentiment numbers reaching bearish extremes we may not be that far off from an intermediate low; time will tell.


