Has Oil Bottomed?
Last week, the U.S. issued waivers to eight countries including China, India, Italy, South Korea, Turkey, Taiwan, Greece, and Japan, which allows them to continue importing Iranian crude, worsening oil producers' concerns about oversupply. On Friday, WTI and Brent crude slumped -1.35 percent and -1.34 percent, continuing a 10-day string of declines and leading oil into bear market territory down more than 21 percent off its October highs. Most sources cited rising crude inventories as the main culprit last week.
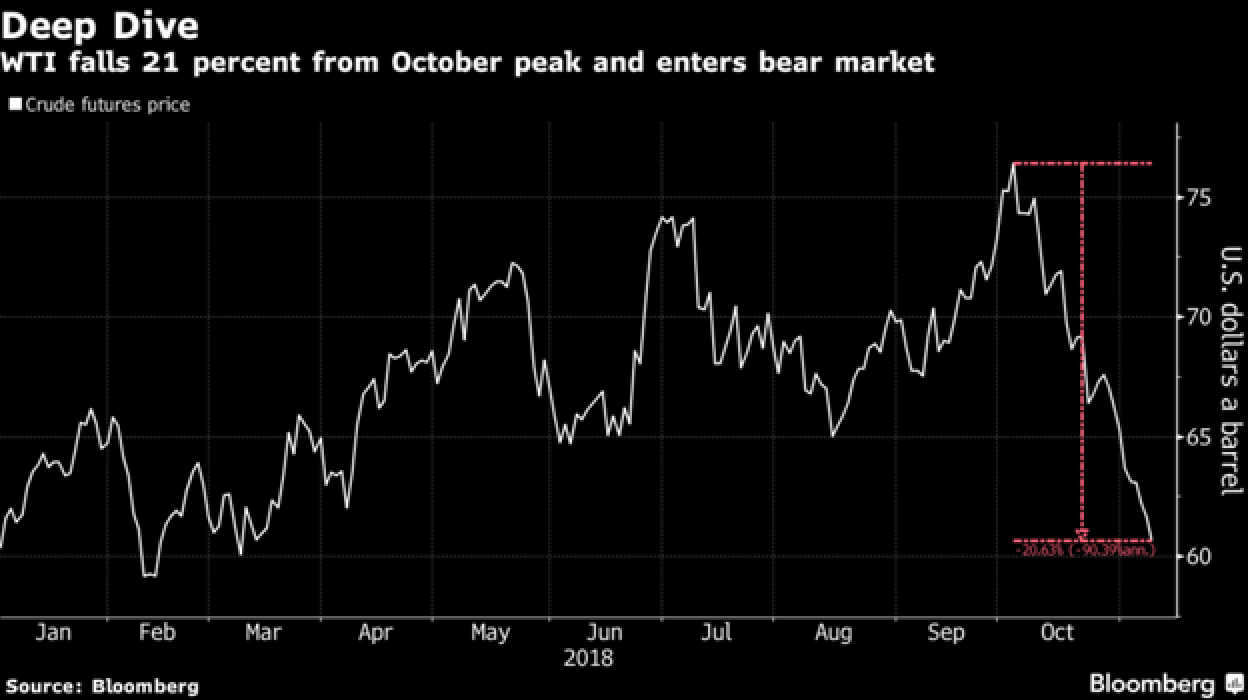
Over the weekend, an OPEC meeting resulted in Saudi Arabia agreeing to reduce oil exports by as much as half a million barrels a day beginning in December, leading to a brief rally on Monday. However, the commodity was down big on Tuesday with WTI falling 7.1 percent, extending oil’s loss to the steepest fall in nearly three years.
“Saudi Arabia’s decision to cut crude exports by 500,000 barrels a day is likely to avert a collapse in oil prices, but probably won’t be enough to stoke a strong rally. The emerging oil glut has been the outgrowth of rising supply and slowing demand,” wrote Bloomberg Intelligence.
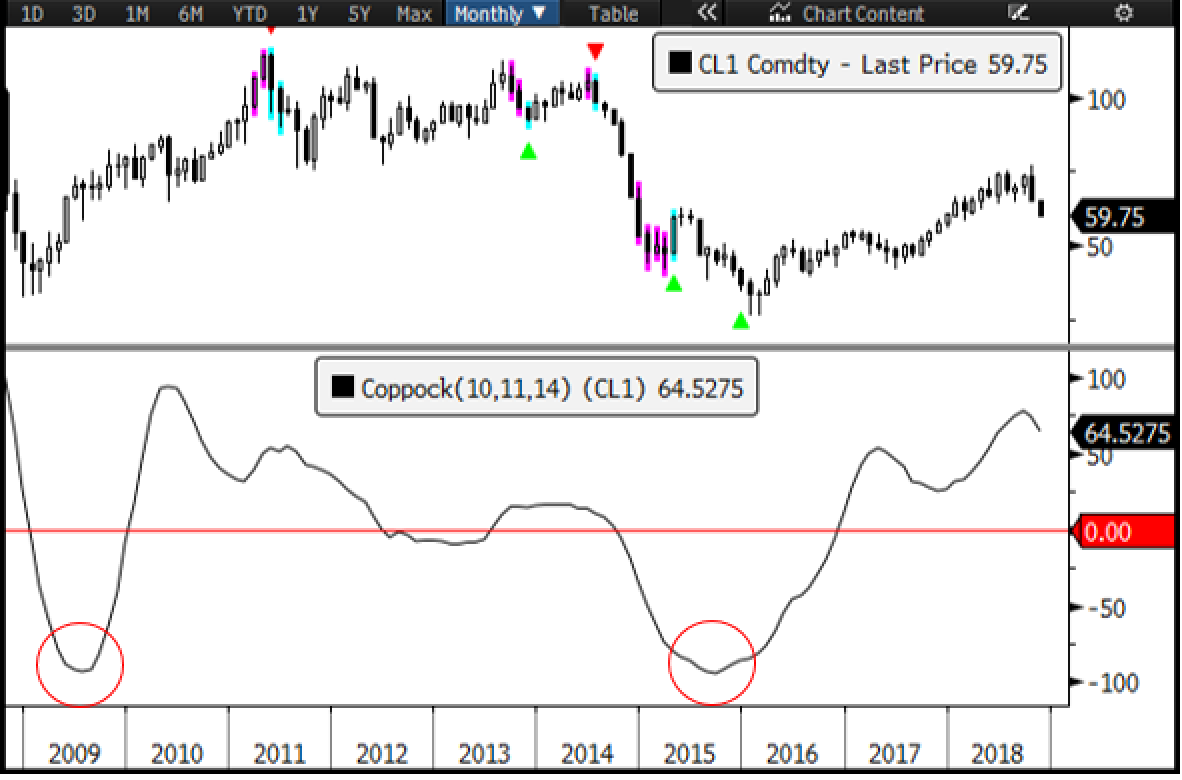
No clear bottom in oil… yet (see Coppock curves for crude down further below).
Midterm Aftermath – Stronger USD and Flatter Yield Curve
Global equity markets were initially pleased with the results, but were led lower by the end of the week with a surge in the USD – and today, the USD hit an 18 month high.


Once election results were solidified, U.S. Treasuries made a big move. Most notable was the two-year / 10-year curve flattening to the lowest level in almost a month (approximately 2.1bps) with a sell-off in the U.S. two-year as the largest move.


As of last Friday’s shift in yields, we are only 25 bps from an inverted yield curve. While U.S. economic data still supports the Fed’s viewpoint that economic growth is strong and steady, the Fed has yet to address the narrowing of the yield curve. We will continue watching this closely in the months ahead. According to Bloomberg, market implied probabilities of a rate hike in December remain steady at 74 percent.
Copping a Look at the Coppock
What Is It?
The Coppock curve is a long-term momentum indicator that was developed by economist Edwin Coppock in the early 1960s. It does particularly well providing long-term buy and sell signals.
Coppock came up with 11 and 14 periods for the for the rate of change (ROC) after studying the average person’s mourning period (which is approximately 11-14 months). He inferred that a downtrend in the markets was like a mourning period, so he used these periods to create a weighted moving average.
How to Interpret the Coppock:
1) Buy / Sell: Is the Coppock above or below base line zero?
2) Increasing / Decreasing: Is the curve’s slope (or Rate of Change) positive or negative?

The Way It Works:
The curve is calculated as a 10 month weighted moving average of the sum of the 14 month rate of change and the 11 month rate of change of a particular index. Monthly trading signals occur on average maybe one to two times every couple of years. Weekly, trading signals can occur one to two times within a year. Coppock can be used on daily charts; the shorter the time frame within the moving average, the higher the number of false trading signals and noise that occur. Buy signals typically occur at inflection points in the Coppock curve and two things must take place: First, the Coppock has to be below zero, and second the Coppock’s momentum must inflect from negative sloping ROC to positive sloping ROC. Sell signals are much less dependable. In general, sell signals occur when the Coppock crosses below zero (also where ROC becomes negative).
Why? The Coppock indicator has been used for years by traders and investors to help determine both long-term and intermediate term bottoms in price moves and significant changes in price trends with a fair amount of success. We recently looked at oil (see charts below). According to the Coppock indicator (inflection points circled in red), there is no clear bottom just yet. We'll keep watching to see if the Coppock continues to hold its ground.