


When the market collapses as it did during December, it’s usually a function of ETF and futures driven selling. Rather than going through the process of selling individual stocks, larger investors use these baskets of securities to effectively sell everything at once. This is especially true when we’re talking about short-term, algorithmic style trading.
When these baskets of securities are sold, it creates a cascade effect in which each of the underlying securities that comprise the basket are in turn sold. The selling is in proportion to how the ETF or futures contract owned the securities in the first place.
The net result is a flurry of indiscriminate selling. Fundamentals are thrown out the window and selling pressure is instead driven by ETF and futures composition. Of course, some investors are trying to be more tactical, but generally speaking, the old adage of throwing the baby out with the bath water becomes appropriate during these unruly times.
Once the carnage is over, investors return to the pile of rubble to begin sorting through the mess. The securities they choose to purchase at this point tell a unique story, because they represent what investors believe will be in demand after factoring in the reasons for the massive reset in stock prices.
In particular, watching which sectors of the market outperform after one of these events provides clues as to what type of economic environment to expect. If investors are snapping up defensive sectors like utilities and consumer staples, it signals concern about the end of the cycle. On the other hand, if they’re snapping up cyclical sectors, it suggests investors expect growth to continue.
In the chart below, we can see sector performance relative to the S&P 500 since the market bottomed on December 24th.
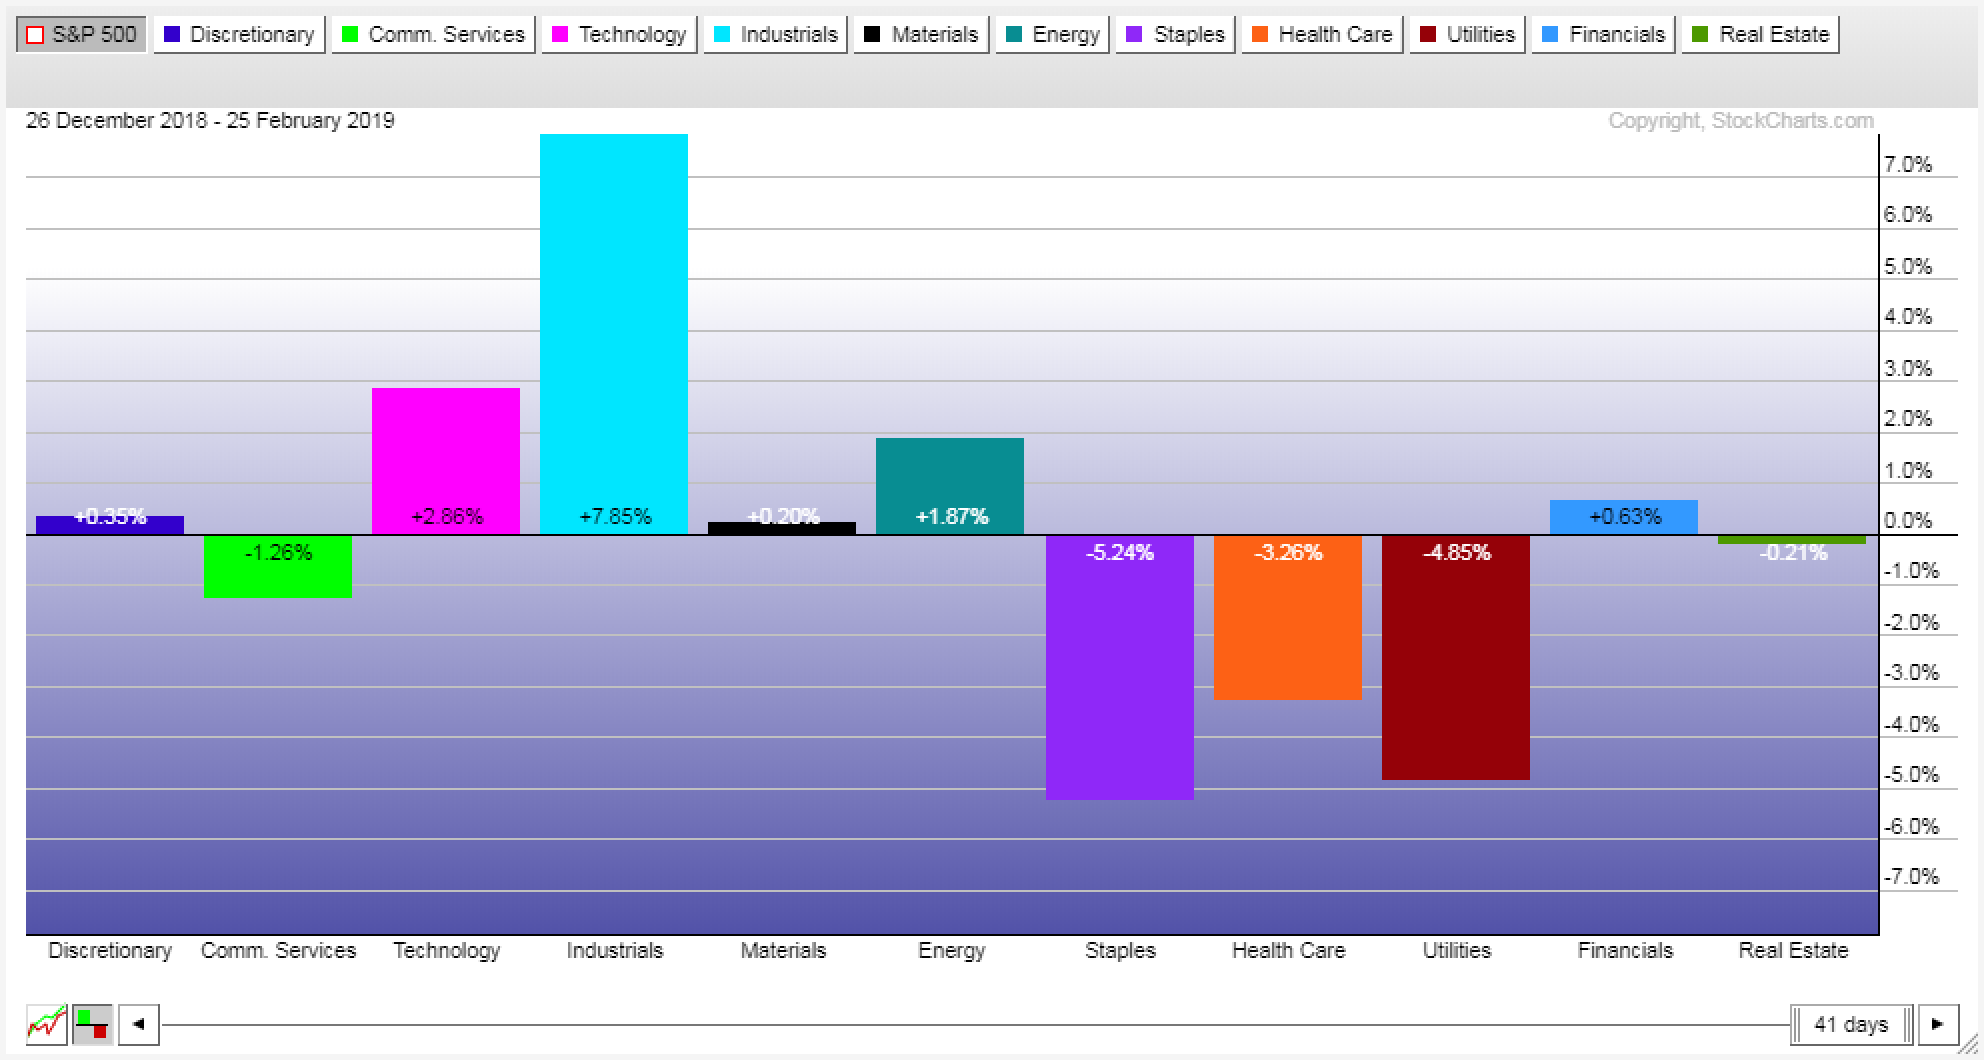
As you can see, it’s the cyclical sectors such as Industrials, energy, consumer discretionary and financials that have been leading the way higher. Defensive sectors such as utilities and consumer staples have lagged behind, indicating a belief that the expansionary phase of this cycle remains intact.
That view has been bolstered by action in a handful of important commodities, namely oil and copper. In this next chart we can see that both of these items have rebounded off their year-end lows.
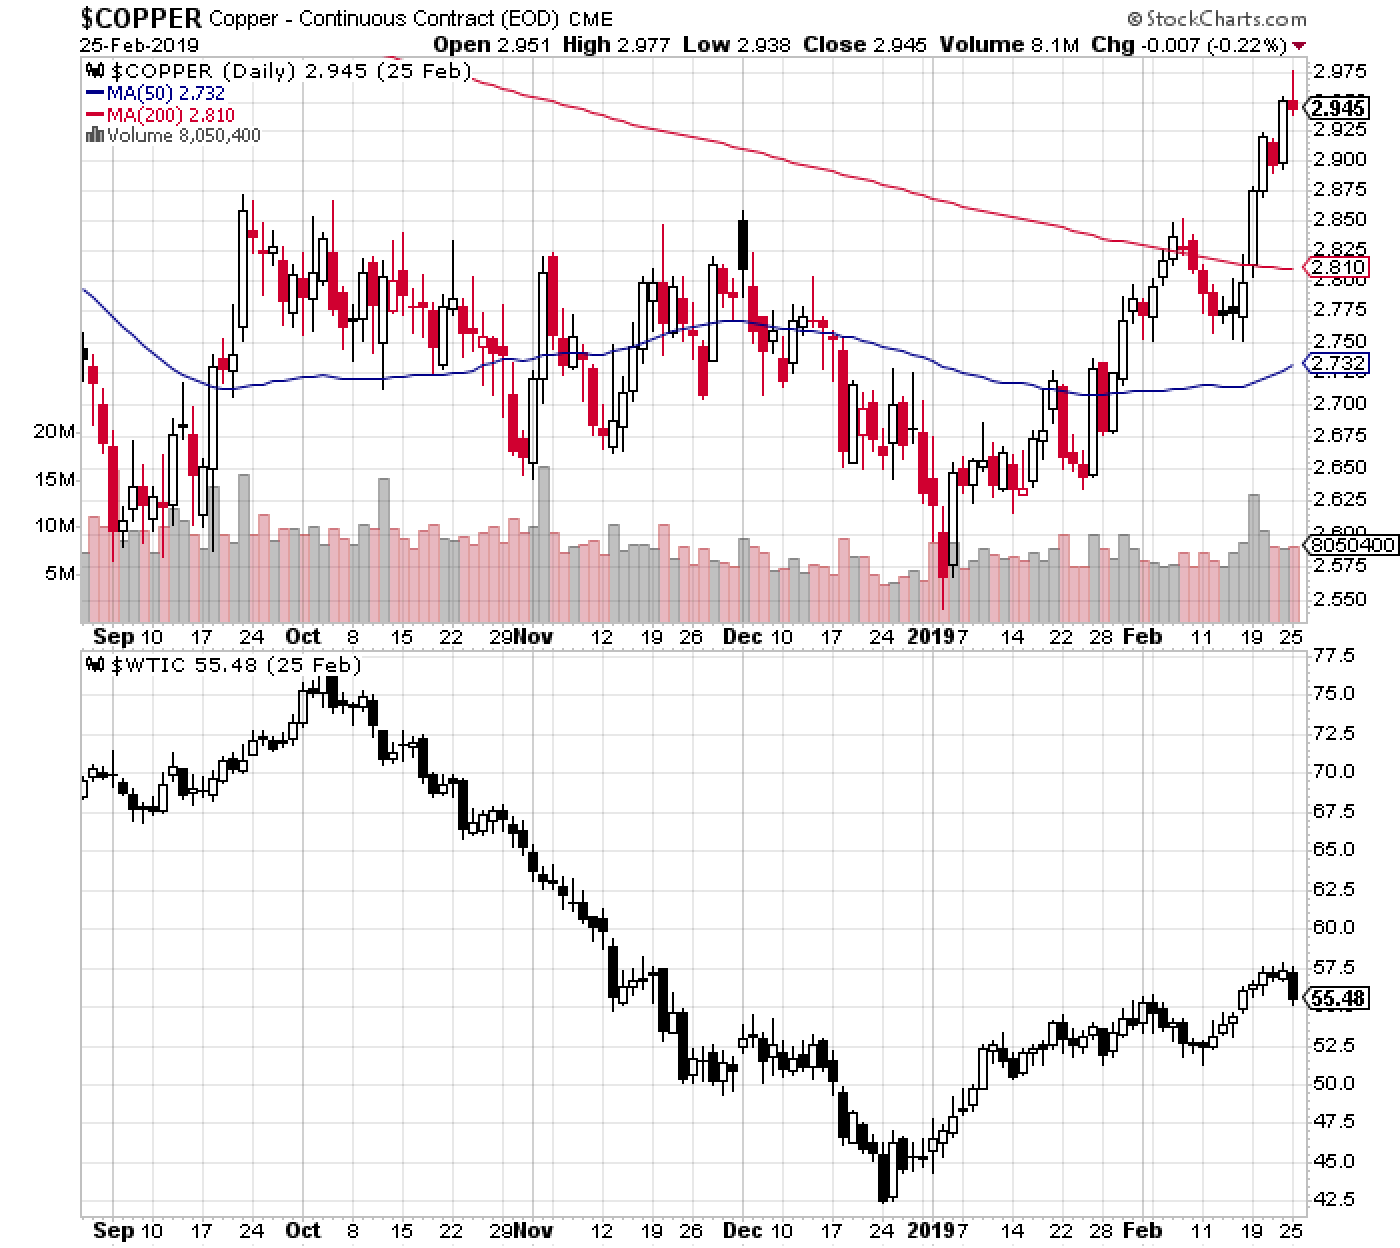
When you add in the rallies we’ve seen across the rest of globe, everywhere from China to emerging markets and even Europe, it gives the impression that global growth is resurging. But as we’ve discussed many times recently, economic data continues to come in choppy at best.
Much of this, it seems, has to do with the amicable tone recently on display regarding US-China trade talks. The market seemed to sniff out the fact that additional tariff increases would be postponed, and recent comments from both Trump and Chinese president Xi Jinping suggest that solid progress is being made.
A resolution to this yearlong standoff would certainly be a positive catalyst for markets, but I believe it’s also possible that the trade standoff is being used as a scapegoat for more than what it may actually be responsible for. If and when it’s resolved, we may find that the current trends in much of the economic data continue.
As an example, consider what we’re currently seeing with housing starts and building permits – two important leading indicators. In the chart below, we can see that both of these items peaked in early 2018 and have since been trending lower.

The deterioration here is not severe, but it’s a sign that more factors than just global trade are at play. Should an agreement with China be reached, I have a hard time believing it will impact these figures in a meaningful way.
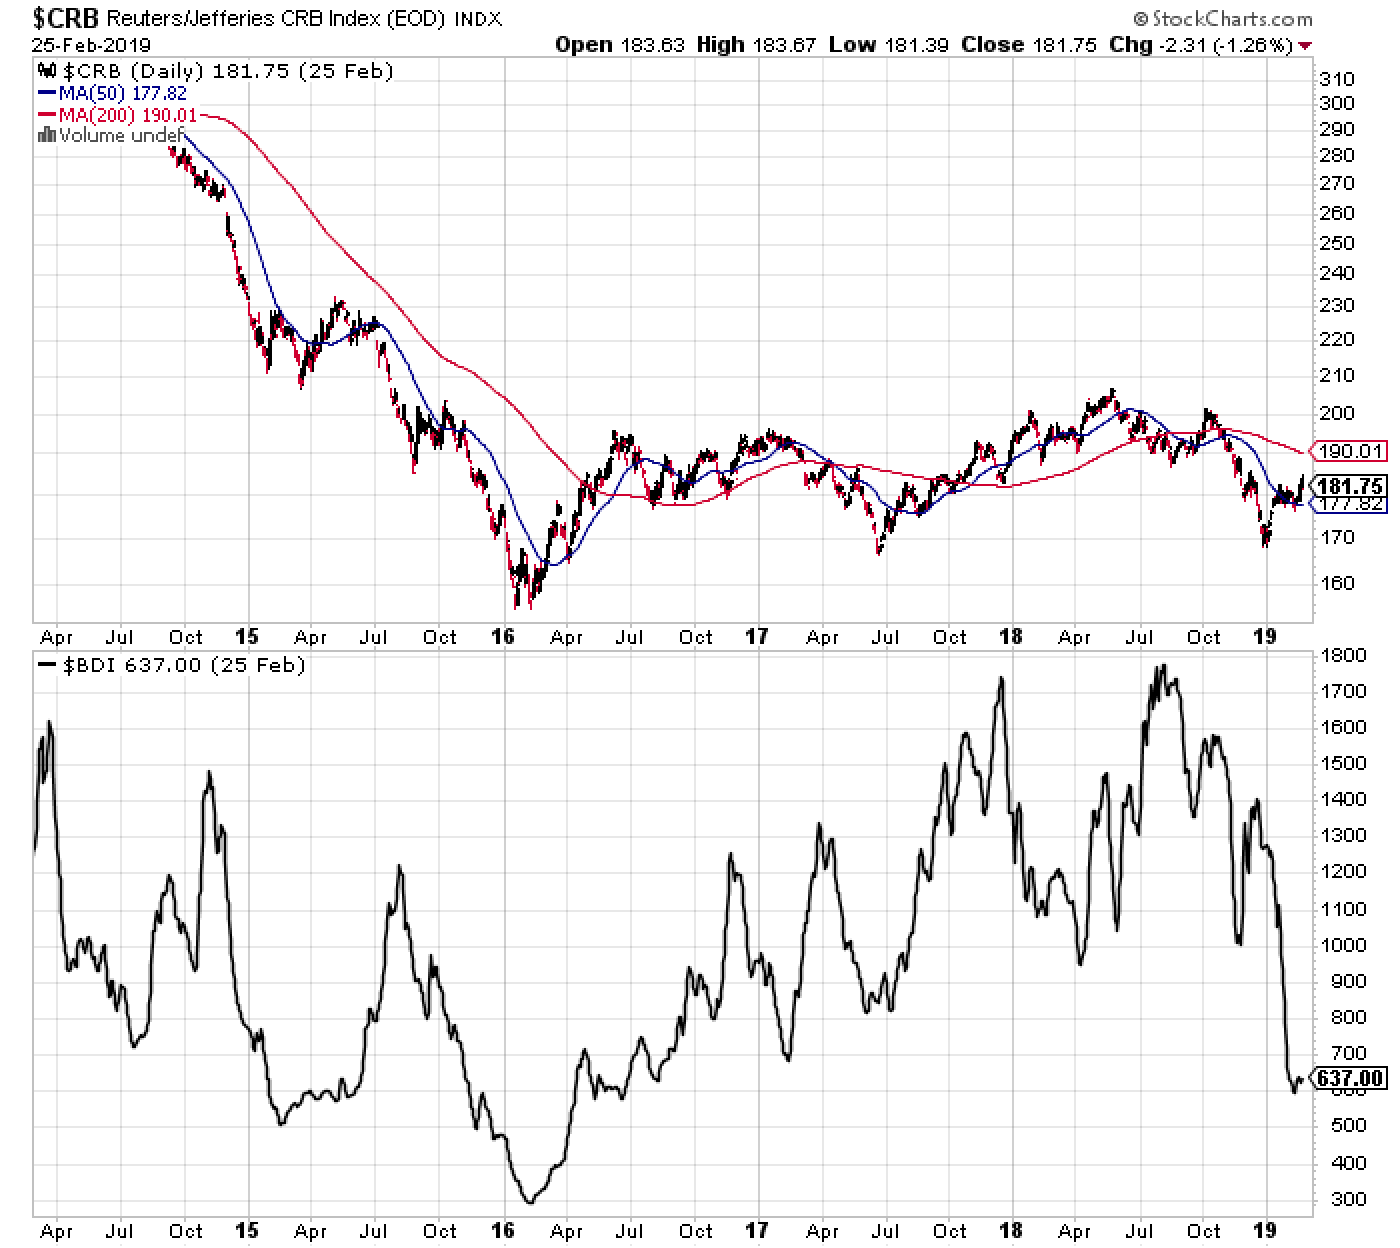
In addition, copper and some of the other industrial metals may be having a good year, but the commodity complex as a whole remains in a longer-term downtrend, as does the Baltic Dry Index – a measure of global shipping demand.
Trade frictions are certainly playing a role in the weakness here, but the question is how big of a role. Is it possible that the deceleration in global growth would be occurring absent this trade conflict?
Right now the investor community is so myopically focused on trade that they may be missing the forest for the trees. I think we need to remember that this expansion is long in the tooth and that invariably, our economy is cyclical.
That said, nothing in the data suggests imminent danger yet. Over the last few weeks we’ve looked at a variety of leading indicators that are rolling over, but most of these provide many months, sometimes years, of advance warning.
From a holistic perspective, this all adds up to the possibility of some type of economic inflection point in the next year or two. But of course nothing is set in stone, and actions taken between now and then will influence how conditions evolve.
In the meantime, I think we need to recognize that this is one of those periods where price action and economic data are generally not painting the same picture, and continue to proceed with caution.
The preceding content was an excerpt from Sigma Point Capital. To receive their weekly updates and research, click here to subscribe. Matt is also the Chief Investment Strategist at Model Investing. For more information about algorithmic based portfolio management, click here.


