


The S&P 500 has had quite a run since the early 2016 lows, not experiencing even a slight pullback of 5% or more, leading many to believe that the market would wobble during the seasonally weak period of August and September. Over the last twenty years, the market has rallied only 55% of the time during August and only 50% of the time during September, losing on average 1.0% and 0.80%, respectively, in those two months before strengthening into the final three months of the year.

Source: Stockcharts.com
This year’s current path has remained strong, bucking the normal seasonal trend as the S&P 500 hits new all-time highs. This is shown below with the year-to-date performance of the S&P 500 shown by the solid line relative to the 30-year seasonal average.

Source: Bloomberg
With August now behind us, bears are still holding out for a major pullback the last few weeks of September. Unfortunately, the message from the credit markets is not giving them much to stand on.
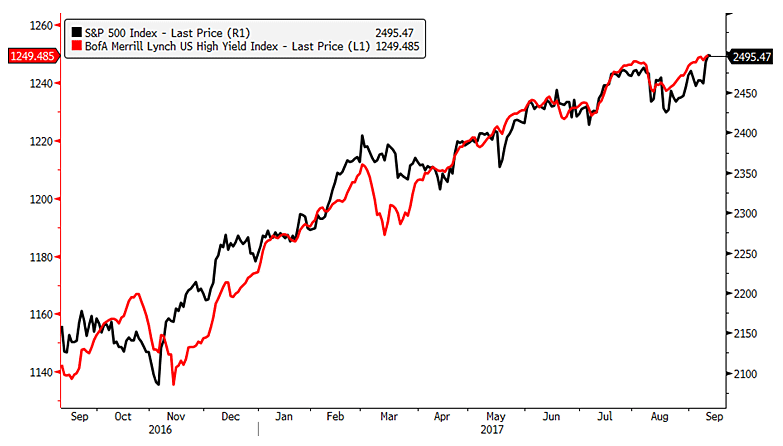
High yield (junk) bonds often serve as a canary in the coal mine and a good example of this was in 2015 when the BofA Merrill Lynch High Yield Index began to weaken several months before the August 2015 summer correction. Then, as the S&P 500 staged a strong recovery, junk bonds continued to sell off through the remainder of the year, eventually pulling the S&P 500 down a second time.

Source: Bloomberg
Just as the junk bond market led on the way down it also led on the way up, confirming the bottom in February 2016 and then hitting a new high in June, one month before the S&P 500 did the same. So, given the high yield bond market can serve as a useful tool to gauge market risk, what is its current message?
“Don’t Worry Be Happy Now”
The junk bond market is echoing the words of Bobby McFerrin’s famous song as it experienced only mild weakness in the last few weeks and hit a new high last Wednesday, ahead of the S&P 500’s new highs seen on Monday.
Source: Bloomberg
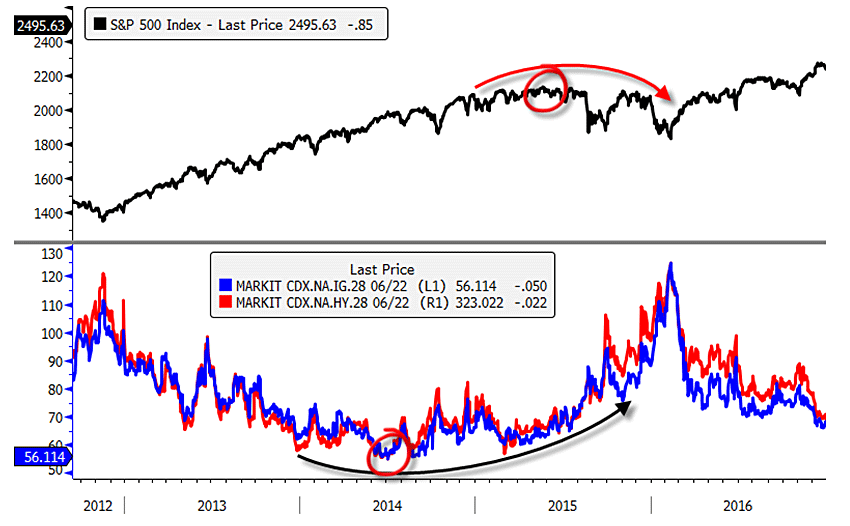
The message from junk bond indices is being confirmed by investors′ fears of corporate bond defaults as measured by credit default swaps (CDS) on investment grade (IG) and high yield (HY) bonds. While the S&P 500 didn’t peak until the summer of 2015 before it went through a rough 6-month span, bond investors were getting uneasy a year earlier. The CDS indices on IG and HY indices bottomed in the summer of 2014 and default insurance began to rise heading into 2015 and really picked up steam just before the summer 2015 correction, giving an early warning to anyone listening of coming market turbulence.
Source: Bloomberg
Major bond investors are signing McFerrin’s song as the cost of CDS protection has fallen since early 2016 and is closing in on the lows seen in 2014 with no early warnings present.

Source: Bloomberg
From a stock market breadth perspective, we are also seeing some encouraging signs of improvement. My last article highlighted that market bottom conditions had not been confirmed (link) but we are now seeing technical evidence to the contrary. For a solid bottom in the markets, you want to see oversold conditions materialize that create enough buying enthusiasm to suggest prices got low enough to bring the bulls back into the markets. Oversold markets that lead to little buying interest tend to be “dead cat” bounces in which even lower prices are needed to entice bulls to enter the markets once more and a bottom to form.
One measure I use to gauge an oversold market is by tracking the underlying behavior of the 3000 stocks in the Russell 3000 Index, which represents 98% of the entire US market capitalization. In the middle panel blow, we measure negative momentum with the percentage of members with their MACD line in positive territory. Readings of 30% and below tend to mark oversold markets and, in late August, we reached the most oversold levels seen since the November 2016 elections.
To answer the question if prices moved low enough to entice bulls into the market and signify a low, I look for buying enthusiasm as evidenced by a surge in positive momentum measured by the percentage of stocks that experience a MACD buy signal. On that front, the recent rally has led to the strongest surge in momentum since the February 2016 lows as nearly 40% of the 3000 members in the Russell 3000 experienced a MACD buy signal (third panel below).

Source: Bloomberg
Bottom line: Given little signs of anxiety coming from the credit markets and a resurgence in market internal momentum, it appears as though the path of least resistance is higher and bearish hopes of a market decline in the seasonally weak part of the year are unlikely to come to fruition.


