


First of all, we want to thank our clients for the privilege of managing their assets and we wish all of you a healthy and prosperous 2018!
They say records are made to be broken and, so far, the US economy is on track to do just that. The current economic expansion is now the third longest in US history going back to 1854. If it can survive through May 2018, it will be the second longest and, if able to survive to July 2019, it will officially become the longest US expansion ever.

Source: JP Morgan, Guide to the Markets
Given the current trajectory and strength of leading economic indicators it appears that the U.S. economy may survive 2018 without the risk of slipping into a recession, raising the possibility of this cycle becoming the longest on record. This is shown below when looking at the US Risk Aversion Index (red line), which leads real Gross Domestic Product (GDP) for the US by 12 months. It began to deteriorate starting in 2015, and reached new cycle lows throughout 2016, but has rebounded since, suggesting a pickup in US real GDP for this year.

Source: Bloomberg, Financial Sense® Wealth Management
Turning to the stock market, the S&P 500 has been in a bull market now for 105 months (almost 9 years), making it the second longest bull market in history. If it can survive through September 2018, it will officially reach a new record to become THE longest bull market in US history.
Looking at other feats, as of January 5th of this year, the S&P 500 went the longest ever on record without undergoing a 5% or more decline. Given the current level of strength and momentum of the S&P 500, we believe this bull market is likely to be the longest on record and continue in 2018.
When we speak of momentum, this is not just an empty term—it is a quantitative measure that changes over time and hits extremes at market highs and lows. One of the most widely-watched measures to gauge momentum is called the relative strength index (RSI), which gives readings between 0 and 100. Bullish momentum is displayed at readings greater than 70 and bearish momentum at readings below 30. The normal way of using momentum is to measure relative strength over 14 periods and, just to give you an idea where we are currently (as of 01/23/2018), the 14-week RSI for the S&P 500 is 89.41—the highest reading ever seen in the history of the S&P 500 going back to 1928! Though momentum is certainly at an extreme reading unlike anything we’ve seen in 90 years, this is still a bullish signal for future market returns until momentum starts to diverge from stock prices, showing that the market is losing strength.
For example, consider a study by regular Financial Sense Newshour guest Craig Johnson, Senior Technical Research Analyst at Piper Jaffray, looking at future returns for the S&P 500 over 13, 26, and 52 weeks (3, 6, and 12 months, respectively) when the S&P 500 has a weekly relative strength reading of 80 (bullish momentum).
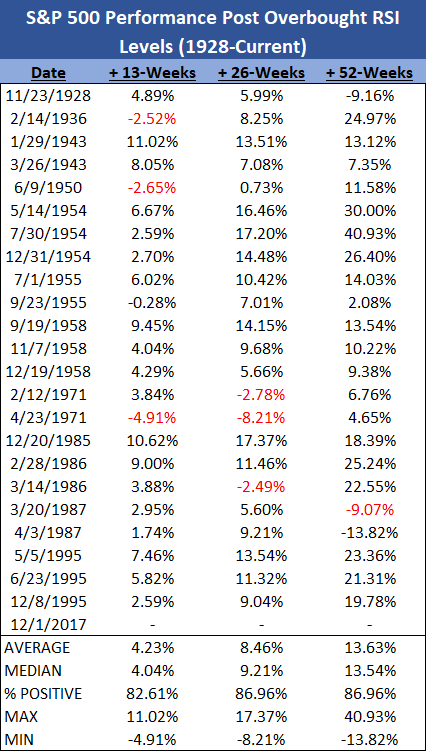
Source: Bloomberg, Financial Sense® Wealth Management; Hat Tip: Craig Johnson
Looking at the table above, the average 3, 6, and 12-month forward returns were all positive. What’s more impressive is that of those events in which the weekly RSI hit 80, the market was higher more than 80% of the time looking at the three measured time frames. Given those odds, history tells us we should expect higher stock prices in the next quarter, mid-year, and by the end of 2018. The trillion-dollar question is, “When will this all end?”
Bull Markets Don’t Die of Old Age
To help answer this question, JP Morgan surveyed each of the major market tops and bear markets since the end of the roaring ‘20s and looked at four different variables related to the macro environment at the time: recession, a commodity spike, an aggressive Fed, and extreme valuations. Here is a table of their results followed by an investigation of our own data into each of these bear market macro drivers.
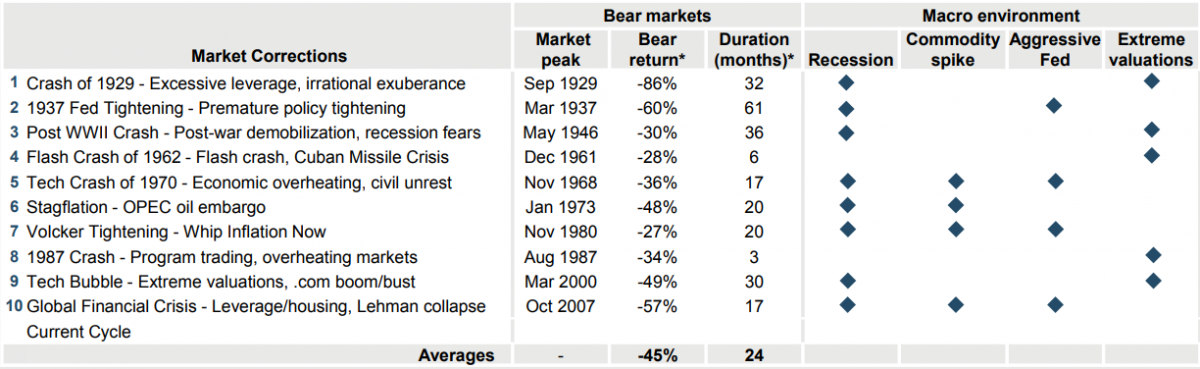
Source: JP Morgan, Guide to the Markets
Bear Market Macro Driver #1 - The Risk of a Recession
As we often note, the most consistent macro driver of a bear market is a protracted economic slowdown, or recession. A visual inspection of declines in the S&P 500 going back to the Great Depression shows that most bear markets occur just prior to the onset of a recession (noted in red).

Source: Bloomberg, Financial Sense® Wealth Management
Our Financial Sense recession model monitors a wide variety of economic data and generally remains below 20 during economic expansions. We have had some close calls during this economic cycle but have not moved significantly above the 20-level threshold since the Great Recession of 2008. Furthermore, given our current reading of 12, it is highly unlikely that the bull market in stocks is in peril due to an imminent recession.

Source: Bloomberg, Financial Sense® Wealth Management
Bear Market Macro Driver #2 – Commodity Spike
The second macro driver associated with bear markets is a spike in commodity prices, particularly oil. As noted years back, oil’s relationship to the business cycle can’t be overstated as Jim Puplava noted in an article penned years ago, “The Petro Business Cycle.” As he pointed out:
Oil is the lifeblood of modern society, powering over 90% of our transportation fleet on land, sea, and air. Oil is also responsible for 95% of the production of all goods we buy and ultimately drives the natural rhythms of recession and recovery.
We can easily observe this by looking at the S&P 500 and oil’s year-over-year price movements going back to the early '70s.
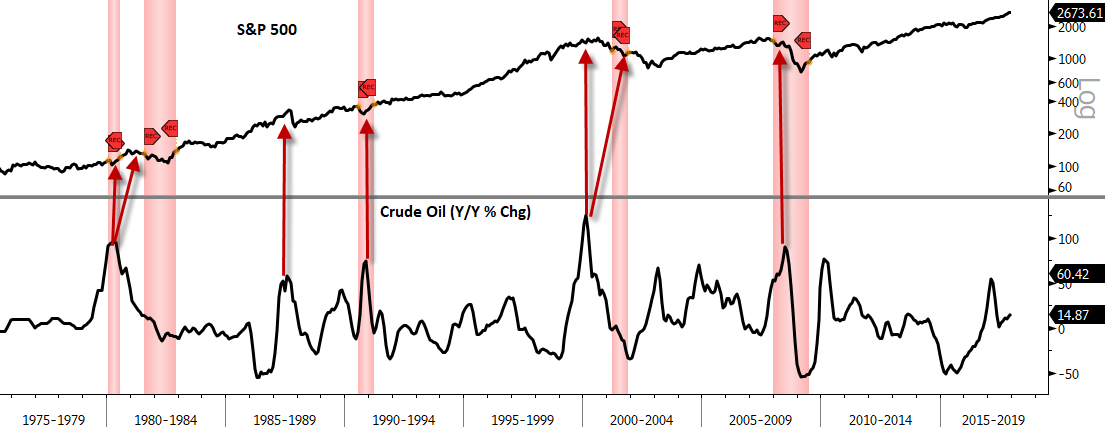
Source: Bloomberg, Financial Sense® Wealth Management
Barring some outside geopolitical event like an outbreak of war with North Korea or a conflict in the Middle East, I do not believe that oil will pose a significant threat to the present bull market and economic expansion for several reasons. In an amazing turn of events, the US is estimated to produce more oil than Saudi Arabia this year and is thus a greater marginal driver of oil prices. The stable increase in production by the US should help keep global supply and demand dynamics in balance.

Another factor that is likely to keep a lid on oil prices is the slowdown we see in Chinese growth. Chinese real estate is very sensitive to moves in government interest rates and the rise in rates over the last year suggests that we should see a decline in Chinese real estate and GDP. A slowdown in China would also likely contribute to a cooling in global growth this year and help mute any oil price spikes.
Bear Market Macro Driver #3 – An Aggressive Fed
The third macro factor often associated with bear markets is an aggressive Fed. As we showed during last year’s investment conference, there is a close relationship between past financial crises and Fed tightening cycles, something that we are in the beginning stages of currently.

Source: Bloomberg, Financial Sense® Wealth Management
The question is: how do you objectively gauge whether or not the Fed is aggressive? The easiest way to answer that is looking at where the Federal Funds Rate is relative to 10-year US Treasury yields. When the Fed Funds Rate is above long-term yields, we have a negative spread between short and long-term rates, which is atypical and highlights points of financial tightness in the economy.
We see negative spreads often just before a recession begins, which is shown below where the Fed Funds rate is subtracted from the 10-year UST yield. Currently, the 10-yr UST yield is more than a full percentage point above the Fed Funds Rate, but that spread will narrow if the Fed raises rates three times this year per the consensus view.

Source: Bloomberg, Financial Sense® Wealth Management
For our own portfolio management process, an important metric we follow is the Federal Funds Risk Neutral Index, comparing Fed monetary policy to current market interest rates and real economic data, to help to gauge the relative tightness or looseness of Fed policy and the risk this poses to the market. As you can see below, the current policy stance is still relatively loose and not yet warning of an overly aggressive Fed.

Source: Bloomberg, Financial Sense® Wealth Management
Bear Market Macro Driver #4 – Extreme Valuations
The fourth macro factor often associated with bear markets is an extreme overvaluation of stock prices.
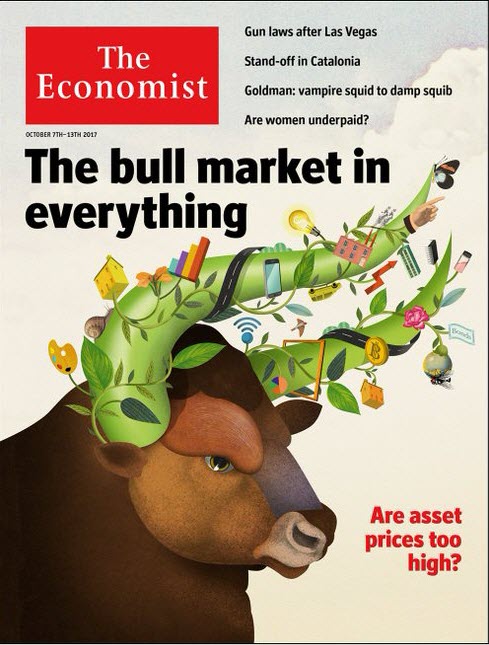
Source: The Economist (October 7th 2017)
During economic expansions, one asset class tends to outshine the others, whether it is bonds, stocks, real estate, or some other financial asset (think tech stocks in 2000 or housing in 2005). But this cycle, everything seems to be increasing in value. Echoing the sentiment of the Economist magazine cover above, even the Federal Reserve Bank of San Francisco highlighted the massive rise in net worth-to-income ratios stemming from multiple asset classes. Here’s what they concluded:
Current valuation ratios for households and businesses are high relative to historical benchmarks. Extending the analysis by Campbell and Shiller (1996), we find that the current price-to-earnings ratio predicts approximately zero growth in real equity prices over the next 10 years. Since the Great Recession, multiple asset classes—real estate, pensions, life insurance reserves, and equities—have been the main contributor pushing the household net worth-to-income ratio to a record high. Historically, these ratios have not remained elevated for prolonged periods, and peaks have been followed by reversions toward their long-run averages [emphasis added].
Looking at current household net worth relative to disposable income and also relative to nominal GDP shows we are at record extremes. As the Federal Reserve Bank of San Francisco points out, these ratios do not remain elevated for long and often come crashing down to their long-term averages. As such, today’s levels do pose a risk to the stock market and other financial assets in the years ahead, but do not serve as a near-term timing tool.

Source: Bloomberg, Financial Sense® Wealth Management
Summarizing the analysis above, the present bull market in stocks and economic expansion are likely to continue given we do not see any red flags suggesting its imminent demise. For reasons cited, we are likely to break several records this cycle as it could quite possibly become the longest bull market and US economic expansion we've ever seen. However, this does not mean it is a time to throw caution to the wind and abandon sound risk management—quite the contrary—since there are some very large risks around the horizon that euphoric bulls are not likely to see coming. We plan on touching on some of these in part II of our quarterly newsletter and to address key themes we see for 2018. If you have any questions about our models or outlook, please feel free to contact me at [email protected].
For more information about Financial Sense® Wealth Management, click here.


