


Buffett is full of pithy quotes. One of my favorites is, “Only when the tide goes out do you discover who’s been swimming naked.” In the realm of investing, the tide of liquidity (or the amount of money circulating in the markets) is primarily affected by expansions and contractions in two primary areas: central bank monetary policy and economic growth rates. Unfortunately, it appears that both of these are now in the process of “going out.”
Don’t Fight the Fed
Let’s first look at monetary policy as it is one of the major drivers of the business cycle and asset valuations. When central banks expand the money supply and lower interest rates, there is more fuel injected into the financial markets to push asset prices higher. The converse is true as well, though the effects typically occur with a 12-month lag. We can see this dynamic at play in the figure below, which looks at the correlation between the amount of money flowing into risky assets (emerging markets, high yield debt) and the balance sheets of the four largest central banks. As the Fidelity analysts note, the $1.4 trillion unwind over the next 12 months will begin to challenge global liquidity growth, which has been a “key support for riskier asset prices and lower volatility.”
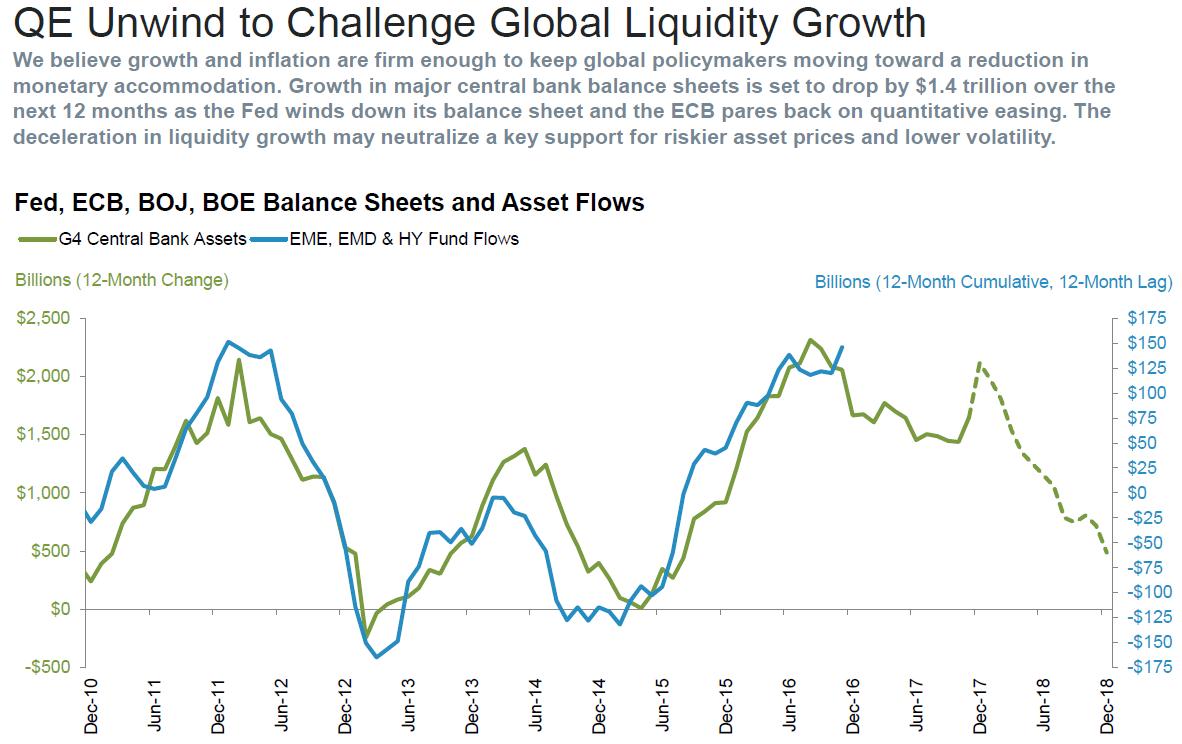
Source: Fidelity Capital Markets, Quarterly Market Update (Q1, 2018)
As seen below, by next year the G4 central banks will not only have slowed the growth of their balance sheets but will be contracting them for the first time since 2015, a very volatile year for risk assets. Additionally, the top 10 developed market (DM) central banks have slowed the number of interest rate cuts and progressively increased the number of interest rate hikes. When central banks move towards a tightening posture, they are essentially taking the punch bowl away from the party.

Source: JP Morgan, Guide to the Markets
Economic Slowdown Ahead?
While receding monetary stimulus is likely to weigh on financial assets, a third potential economic slowdown would certainly compound the situation. During the business cycle when economic growth remains positive, the speed of that growth can accelerate and decelerate without moving into an outright contraction (negative growth). This can be seen by looking at the Conference Board’s Leading Economic Index (LEI), which does a good job at forecasting future economic growth as measured by our country’s gross domestic product (GDP). Growth slowdowns are highlighted in yellow and recessions are highlighted by the red vertical bars. During this business cycle, we have witnessed three acceleration phases (2009-2010, 2012-2014, 2016-present) and two growth slowdowns (2010-2012, 2014-2016).

Source: Bloomberg, Financial Sense® Wealth Management
Forecasting future economic growth is important for investors as the stock market’s annual performance tends to move in concert with the growth rate of LEIs. This investment and economic dance is shown below in which the S&P 500’s annual performance (in black) moves in tune with the Conference Board’s LEI annual growth rate (in red). Looking at the figure below, we can see how annual stock performance is impacted by growth accelerations and slowdowns.
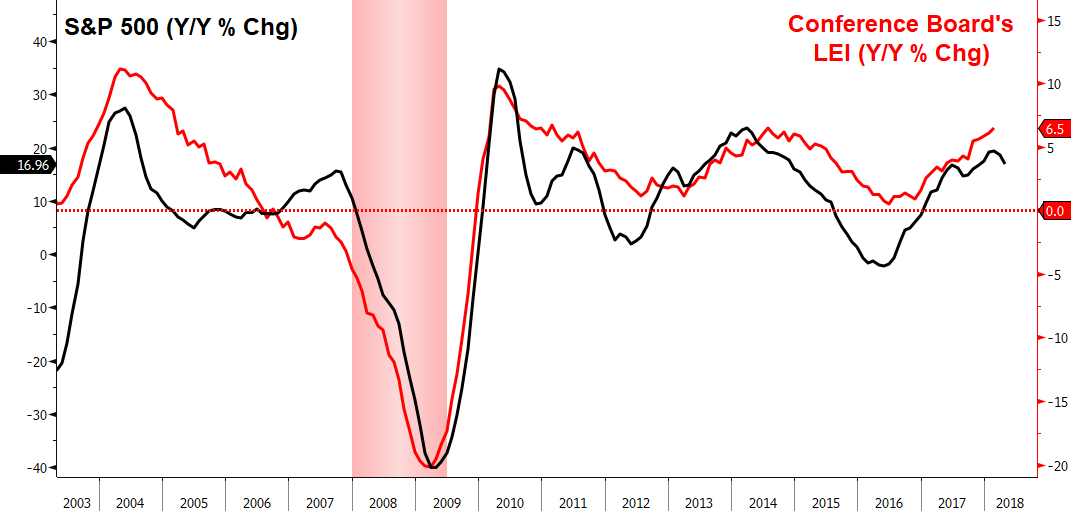
Source: Bloomberg, Financial Sense® Wealth Management. Past performance is no guarantee of future results. All indexes are unmanaged and cannot be invested into directly
If one was able to forecast trends in the growth rate of the Conference Board’s LEI, they may have a rough guide as to how stocks may perform in the future. Fortunately, there are some indicators—like the US Risk Aversion Index—that “anticipate” moves in LEIs, which is why they are often characterized as “anticipatory LEIs”. Currently, the US Risk Aversion Index is calling for this expansion’s third growth slowdown to take place this year and, if correct, there is a good chance that the stock market will face headwinds.
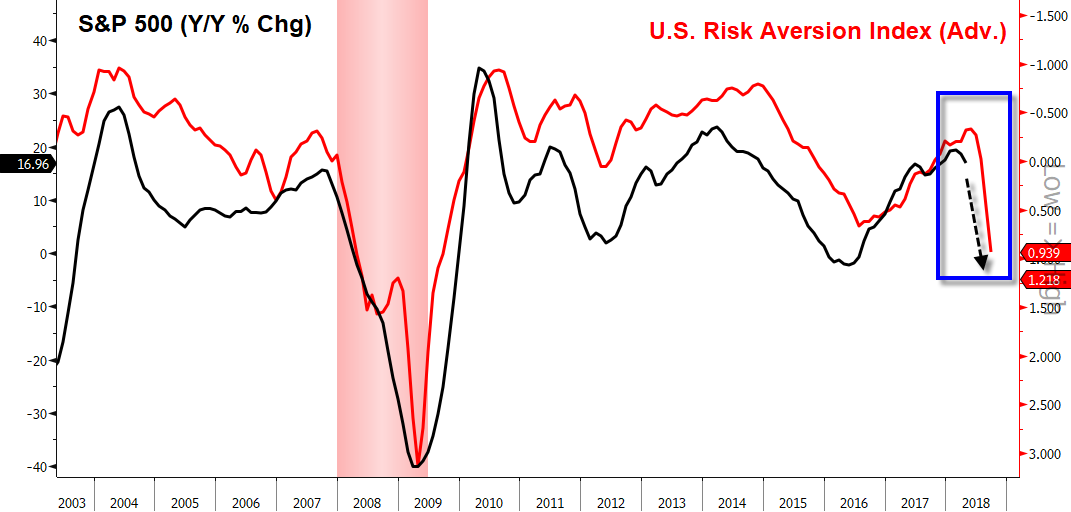
Source: Bloomberg, Financial Sense® Wealth Management. Past performance is no guarantee of future results. All indexes are unmanaged and cannot be invested into directly
The US Risk Aversion Index is not the only anticipatory LEI rolling over. One particular measure we monitor looks at the momentum of the yield curve, which is also projecting a growth slowdown over the coming months.
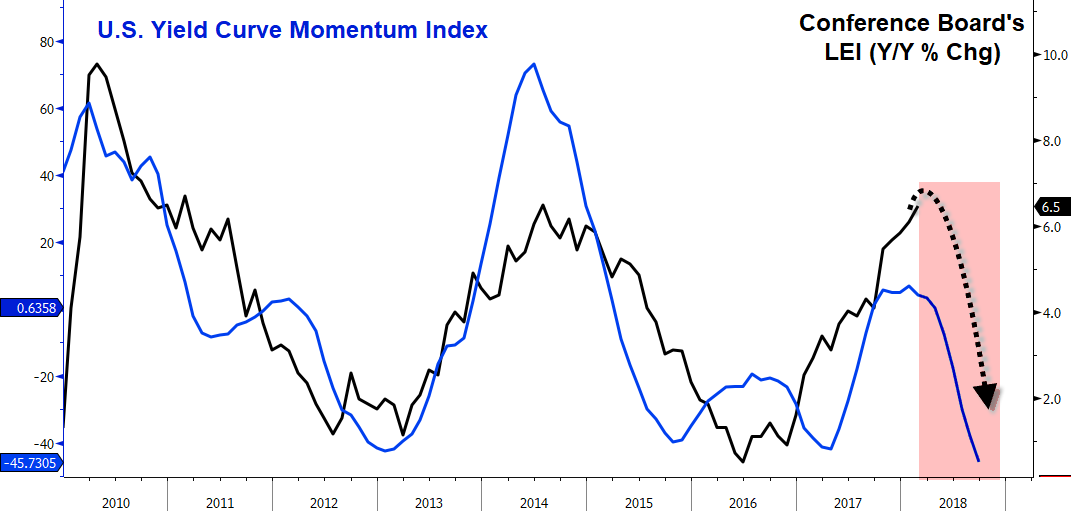
Source: Bloomberg, Financial Sense® Wealth Management
For Everything, There Is a Season
The potential growth slowdown may impact the markets at an unfavorable time of the year. As it has paid to listen to the Wall Street axiom of “don’t fight the Fed,” there is another market axiom that says to “sell in May and go away.” This saying comes from the observation that stocks tend to do better during the November to April period than the May to October period. There is some validity to this saying as the S&P 500 since 1950 has averaged a 6.9% return during November to April while only a 1.6% return during May to October. Looking at a 30-year seasonal average chart of the S&P 500 shows this to be the case.
S&P 500: 30-yr Seasonal Chart
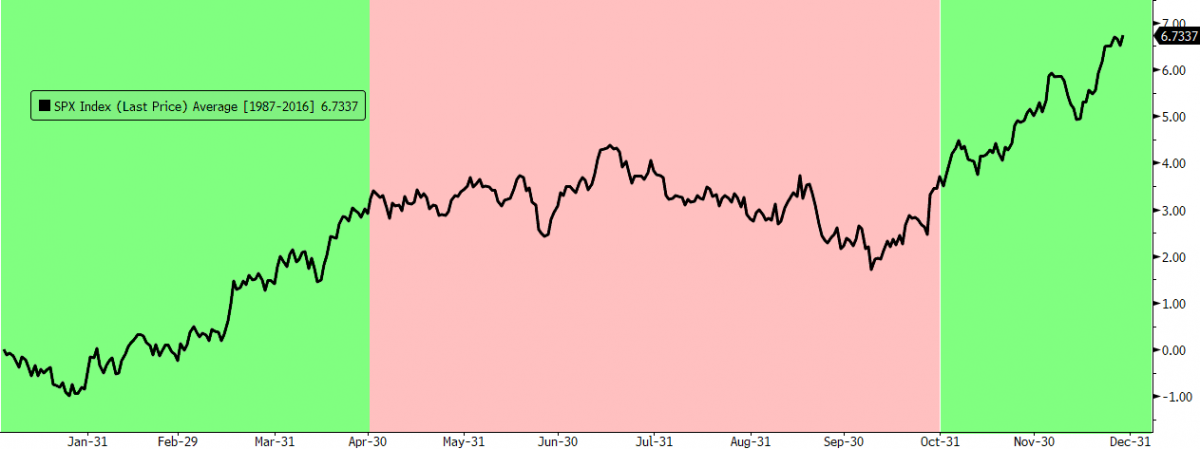
Source: Bloomberg, Financial Sense® Wealth Management. Past performance is no guarantee of future results. All indexes are unmanaged and cannot be invested into directly
In addition to the above, the uncertainty of a mid-term election is approaching. Looking back at the market since 1950 shows they tend to be volatile years with an average maximum decline of nearly 17% and a calendar year return of 6.7%.
S&P 500 Mid-Term Election Drawdowns and Annual Returns
Source: Bloomberg, Financial Sense® Wealth Management. Past performance is no guarantee of future results. Please note: The modern design of the S&P 500 stock index was first launched in 1957. Performance back to 1950 incorporates performance of the predecessor index, the S&P 90.
The normal seasonal pattern of “sell in May and go away” tends to be more pronounced during mid-term election years and if the S&P 500 does follow the typical script of selling off heading into election season, the next few months may be a bit rocky. It’s during these times when the monetary liquidity and economic growth tide go out that we find, again, which financial entity has been swimming naked. In the 2010-2012 slowdown, the poster child was Greece. In the 2014-2016 slowdown, it was oil-producing countries as well as the US shale industry. Who will it be this time around? Time will tell.
At Financial Sense® Wealth Management, we are currently positioning for a potential growth slowdown and rocky summer by selling stocks, raising cash, and buying short-term US T-bills quickly approaching 2% annual yields. With the current bull market and economic expansion closing in on the longest in history, any growth slowdown needs to be taken with more scrutiny in case it develops into a full-blown recession. Therefore, we will be watching our anticipatory LEIs closely in the months ahead to see if they signal a positive turn or further deceleration ahead. If we get the former, we will put cash back to work; if the latter, we will batten down the hatches and get more defensive.
To find out more about Financial Sense® Wealth Management or for a complimentary risk assessment of your portfolio, click here to contact us.
Advisory services offered through Financial Sense® Advisors, Inc., a registered investment adviser. Securities offered through Financial Sense® Securities, Inc., Member FINRA/SIPC. DBA Financial Sense® Wealth Management.


