


Over the past few years, I’ve written many a time about the fingerprint character differences we are seeing in the current economic and financial market cycle relative to historical experience. Housing prices levitate as mortgage purchase applications hit five year lows, while both new home sales and housing starts rest near five decade lows. The year over year rate of change in bank loans and leases outstanding show us the lowest growth rates in decades as the banking system loan to deposit ratio hits downside levels not seen in 30 years. US corporate profits relative to GDP hit all-time highs while wages and benefits as a percentage of GDP hit historical lows. I could continue on, but I’m sure you are already more than well aware of the noticeable historical dichotomies of the current cycle.
In this discussion I want to address what we are seeing in terms of corporate deal flow activity – mergers and acquisition, venture capital and private equity investment. Here also we are seeing a number of differences relative to prior cycles. Of course the important issue becomes, just what are these differences “telling us” about the current cycle? Not that this is universally true, but especially the VC and PE community have been considered “smart money” historically. We just need to remember that their activity is also influenced by their funders/investors over time. Let’s look at some data and hopefully make a few semi intelligent observations.
The chart below was produced by the NY Times/Dealbook blog. It’s a look at nominal dollar worldwide and US specific M&A activity since 2000. What has been a hallmark character point of prior economic expansion cycles is that M&A activity has increased throughout each cycle, usually hitting crescendo pitch 9-12 months before each economic and financial market cycle peak. Both on a worldwide and US specific basis, current M&A activity today remains far from the near coincident nominal dollar activity peaks of the two prior cycles. Punctuating this divergence is the fact that corporations have available to them the lowest cost of debt capital in a generation in the current cycle, yet M&A activity remains very subdued. Clearly, corporations have instead used the debt markets to arbitrage implicit returns generated via stock buybacks. One would think this current period of high equity valuations and historic lows in debt capital costs would have engendered an M&A boom unlike anything seen in quite some time. Quite the opposite as recent M&A activity is nearer the lows of the current and prior cycle than not.

One of the reasons I’m addressing this larger topic of deal flow is that I’ve seen commentary suggesting that there is no way US equities can be in a current bubble when deal flow activity is so tepid. I think it’s only fair that investors at least consider the other side of this argument. As an alternative viewpoint, could it be that M&A activity is subdued because corporate executives see less growth ahead, and hence less benefit in business expansion in the current cycle than in simply buying back their own shares? It’s a perceptual viewpoint worthy of consideration. It indeed mimics the thinking that what the central bankers are doing is certainly influencing the financial markets, but not real economic growth.
It’s more than interesting to note that the current nominal dollar level of M&A activity has been seen during historic periods of broader uncertainty about the macro economy, corporate profit margins and ultimately earnings growth. Wasn’t this the case near the M&A activity lows of 2003 and 2009? Lows not far from current deal flow levels? I can only assume that if the corporate crowd saw meaningful growth opportunities ahead, M&A activity in today’s environment may even surpass what we saw in early 2000 and at the secondary peak in 2007.
Let’s switch gears and look at the character of venture capital. The history of nominal dollar venture capital investment is a bit different than what we saw above, but speaks to perhaps similar concepts. Below is a look at life among the venture capital community with data from the National Venture Capital Assoc. from 1995 to present. We’re looking at total investment as well as average per deal size. It may seem surprising, but VC investment has been range bound for over a decade. Highlighting this flatness is the fact that tepid activity has been witnessed throughout the rise of both mobile and social tech startup booms. The 2013 data in the charts below have been annualized using actual data through 3Q of this year.
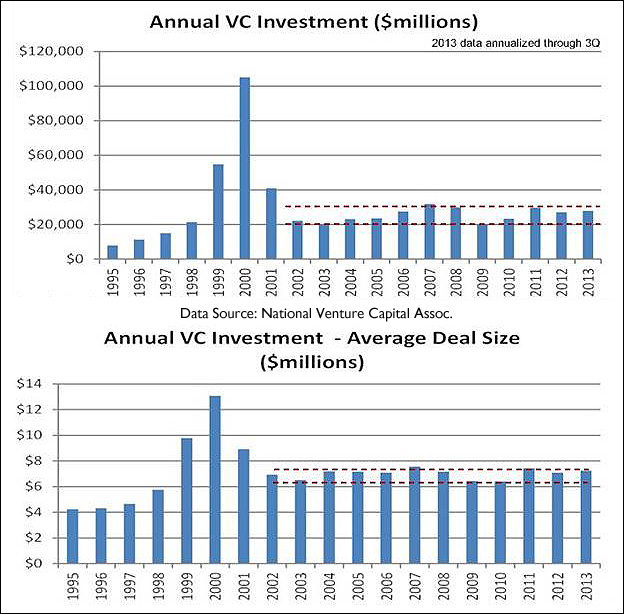
Although it’s just a personal comment, I would have expected at least some uptick in VC investing during the multi-year period of initial skyrocket growth in both segments of the tech universe. Despite 55% of VC investment having occurred in California this year, overall US activity will barely eclipse 2012 numbers and not hit what was seen in 2011.
Finally, a little peek at private equity activity courtesy of data from Pitchbook that stretches back to 2004. Although you may not be able to decipher this from the chart, the spike in investment each year since 2008 came specifically in each 4Q period. Remember, money raised in the PE community can often be subject to investor redemption if not put to work. Perhaps a little motivation for the consistent 4Q spikes in each year since 2008. Nonetheless, absent the spikes (which themselves aren’t even close to the prior cycle nominal dollar investment highs), PE investment activity has virtually been flat over the past four years. This is a completely different trajectory than was seen in the prior 2004-2007 PE investment acceleration cycle.
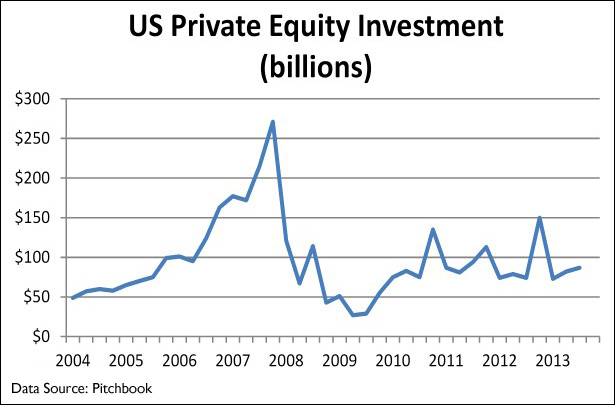
One last quick PE fact of the moment. The global private equity community today is sitting on a record level of nominal dollar “dry powder”. Plenty of liquidity not finding its way into actual economic deal activity. Why? The only explanation I can come up with is the PE community does not see attractive return on invested capital.
One last perspective I alluded to at the start. Deal flow activity, especially in the VC and PE sectors, is very much influenced by institutional investment flows. Think about the pension funds of this world starving for rate of return with ever fewer outlets for investment courtesy of the Fed and global central bankers. Record dry powder (idle cash) in the worldwide PE community suggests there is more than plenty of capital for investment. Moreover, the PE firms are not charitable organizations as they, like many, are focused on AUM and fees. And yet a record amount of potential investment capital in the industry lies fallow. There is a message about the real economy in this collective set of circumstances.
Remember, the data you’ve seen above has been used to argue equities are nowhere near bubble territory. This is despite the simultaneous occurrence of all-time highs in the S&P price to revenue ratio, a Bob Shiller CAPE ratio in valuation territory only seen four times in the last century, and a market cap to GDP ratio in rarified air based on historical context.
Trust me, I’m NOT trying to make a comment on stock bubbles or otherwise. My intent is strictly to provide perspective for forward thinking and consideration in investing as opposed to specific action. My takeaway from the above is the following. Importantly, price to revenue ratios, CAPE numbers and market cap to GDP relationships all describe the financial markets. I’d suggest to you that M&A, PE and VC activity describes growth opportunities, or otherwise, in the real economy. To me, current activity in the M&A, PE and VC sectors is simply yet another “financial market versus real economy” divergence of note. Personally, I think it’s an important divergence. Looking into 2014, the Street is once again anticipating macroeconomic acceleration and meaningful corporate earnings growth. Collectively, VC, PE and M&A character does not appear to share that enthusiasm. What’s the deal with that? Take all of this for what you will and incorporate it into investment thinking, or otherwise, as you see fit.


