


This is an excerpt from the January 6, 2012 blog for Decision Point subscribers.
After reaching an all-time high in August, gold has corrected about -18%, but a recent bounce prompts us to take a closer look to see if the correction could be over. The most encouraging technical evidence is on the weekly chart.
Note how the recent low occurred just above the long-term rising trend line. From the beginning of the correction I thought that this trend line was a logical downside target. Whether or not the bounce off this line is the beginning of a new up leg destined to take out the August highs, has yet to be determined.

The fact that the support has held is very positive, but the weekly PMO (Price Momentum Oscillator) configuration is still negative -- falling below its EMA, and still somewhat overbought.
Shorter-term the daily PMO below is oversold and has bottomed, but the price line has encountered resistance at the 200-EMA.
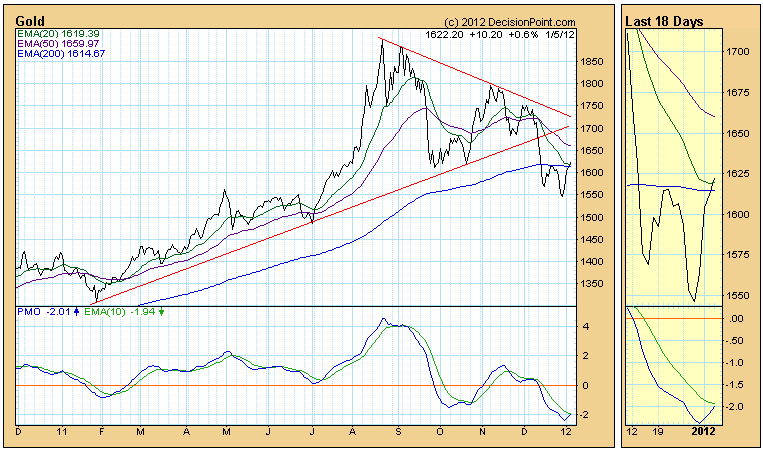
Our Trend Model for gold is currently neutral (in cash or fully hedged), and a new but signal will not be generated until the daily 20-EMA crosses up through the 50-EMA. That will probably take a few weeks if prices continue to rise.
Bottom Line: The correction has been of sufficient depth and duration that the bounce off long-term support presents a short-term buying opportunity for those anxious to exploit the next leg up, assuming that there will be one; however, not enough tumblers have fallen into place to justify anything but very tight stops.


